By Michael Kuser
RENSSELAER, N.Y. — Significant natural gas price spreads between Western and Eastern New York in 2016 led to New York City generation being “more economic than in recent years,” Pallas LeeVanSchaick of Potomac Economics, director of NYISO’s Market Monitoring Unit, told the ISO’s Business Issues Committee on May 17.
In presenting the 2016 State of the Market report, LeeVanSchaick said natural gas prices on the Transco Zone 6 pipeline, serving New York City, averaged $2.19/MMBtu, roughly halfway between Millennium Pipeline’s $1.46/MMBtu and Iroquois Zone 2 at $2.84/MMBtu.
Enhancing the Energy Market
The report makes several recommendations to enhance energy market performance, primarily to real-time market operations and capacity pricing. The real-time change would be to consider rules that would adequately compensate all resources that relieve congestion while factoring in performance and the marginal cost of maintaining reliability.
LeeVanSchaick said 92% of real-time congestion on 345-kV lines into the city occurred when reserve units were not believed to be available.
The report also recommends implementing location-based marginal cost pricing of capacity, which would save tens of millions annually and reduce volatility of prices and requirements.
Looking Forward
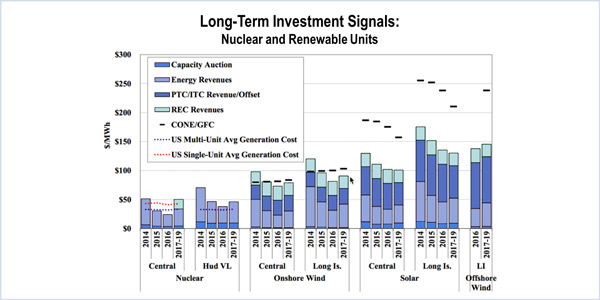
On long-term investment signals, LeeVanSchaick said the MMU does not estimate new environmental costs going forward, such as dramatic changes in Regional Greenhouse Gas Initiative costs. “We use price tails, old CAPEX [capital expenditures],” he said, repeatedly telling market participants that the report was based on publicly available data.
LeeVanSchaick was questioned on renewable forecasts that show a higher-than-market $240/MW cost of new entry for offshore wind off Long Island. LeeVanSchaick said the CONE assumed a 30-mile cable; a project closer to shore would reduce the projected estimate. The report also assumes for generators a “modest recovery of revenues going forward,” based on forward prices.
Deficiencies in New Zone Creation Process
The report says that while the new capacity zone for the G-J Locality in Southeast New York (SENY) has greatly enhanced the efficiency of capacity market signals, the new zone took years to create after it was first needed. This delay saw capacity in Zones G, H and I fall by 21% from 2006 to 2013, even as the need for resources in the SENY interface became more apparent.
One problem with the process is it being based on the highway deliverability test criterion, which ignores the reliability issue that would justify the creation of a new capacity zone. This can lead to additional capacity being procured on the constrained side of a transmission bottleneck to meet the reliability needs of the load pocket. For example, a 1% increase in the local capacity requirements equated to a $1.30/kW-month increase in capacity prices given the 2013/14 demand curve for New York City.
The report cites the retirement of the Indian Point nuclear plant as a “salient example” of the problems that can arise from the shortcomings in the new zone creation process. If Indian Point retires in 2021, and it leads to resource adequacy violations for Eastern New York or the area south of the Upstate NY-Con Ed interface, the “process would not consider creating an additional zone for any time before 2025. In fact, it would not trigger the creation of a new zone at all if there are no highway deliverability constraints.”
The report recommends NYISO adopt “a dynamic framework where potential deliverability and resource adequacy constraints are used to pre-define a set of capacity interfaces and/or zones.”


