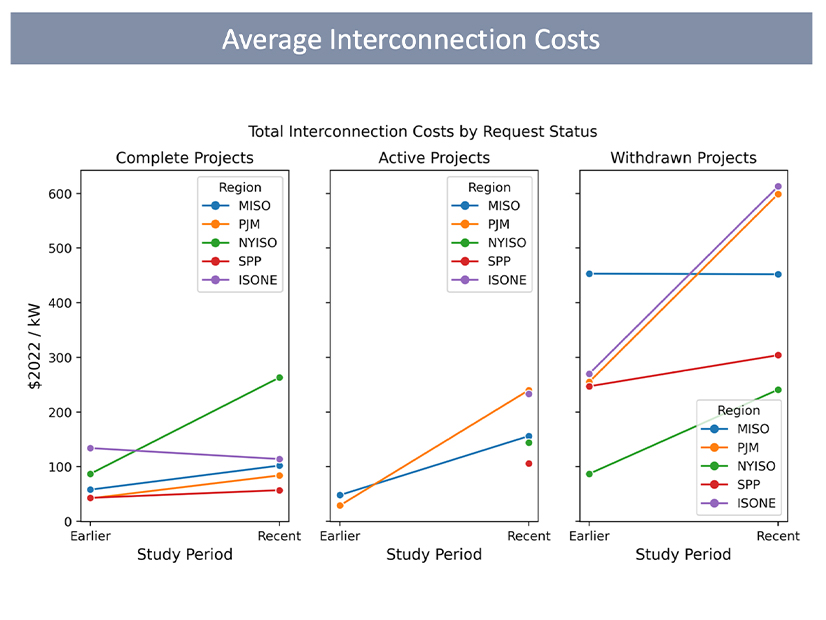
Interconnection costs are on the rise across the U.S., according to a Lawrence Berkeley National Laboratory analysis of thousands of projects in five organized electricity markets.
Interconnection costs are on the rise across the U.S., according to a Lawrence Berkeley National Laboratory analysis of thousands of projects in five organized electricity markets.
The team manually scraped cost estimates from 2,500 interconnection studies from ISO-NE, MISO, NYISO, PJM and SPP, LBNL policy researcher Joachim Seel said during a webinar Thursday. CAISO has stronger data privacy rules than others, while ERCOT uses a “connect and manage” system that limits the amount of upgrades developers must pay for. Non-RTO regions generally do not release such information.
“Collecting this cost data has been quite difficult as the cost estimates are often the only available interconnection study PDFs, [and] that required time-intensive manual scraping,” Seel said. “We’ve cleaned and sanitized the data and made much of the underlying project cost data available on our website. And to our knowledge, this is really the first time that this data can be easily accessed.”
The data collection was partially funded by the U.S. Department of Energy’s Interconnection Innovation e-Xchange (i2X) process, said DOE’s Cynthia Bothwell, who helps run the exchange created to enable simpler, faster and fairer interconnection of clean energy resources.
“The motivation for the cost analysis that you’re going to hear about more today was that we found it very hard to get information,” Bothwell said. “Developers said, ‘You know, we don’t know how much things cost, [or] where we can interconnect, and a lot of other issues.”
While the data was public, it was not easy to gather — taking hundreds of worker hours per market to compile. Now the industry will have a central place to look up interconnection cost information, she said.
The LBNL team plans to continue collecting data, including eventually from CAISO and traditionally regulated utilities, and performing additional analyses, Seel said. While costs have been trending up, they vary greatly by project type and other factors, meaning they are “not normally distributed,” he said.
“There are many projects with rather low interconnection costs, but also some projects with very high interconnection costs,” he said. “And although these high-cost projects may be fewer in number, their high project costs can influence the sample mean quite a bit and pull it upward.”
Out of the projects that have made it through PJM’s queue since 2017, nearly 120 had interconnection costs of $25/kW, but some were several times higher than that — with a few at $450/kW.
Costs have been on the rise over time, and LBNL broke down projects by complete, pending and withdrawn, with those pulling out of the process having the highest average costs and completed projects the lowest, Seel said.
Newer projects must generally pay for more broad transmission network upgrades triggered by reliability or stability violations found in the modeling of the proposed resource. That could involve reconstruction of high-voltage transmission lines as renewables are often in more rural areas where the grid is weaker.
Breaking Down by Project Type
The analysis also found differences among technologies, with solar costs remaining fairly consistent across regions, and completed projects spending between 5% and 10% of their total capital on interconnection upgrades, while withdrawn projects faced interconnection costs comprising 20% to 40% of their total capex.
Storage projects also face high costs, which Seel said could be due to their being built in congested parts of the grid to benefit from energy arbitrage opportunities.
Onshore wind has greater variation, with completed projects spending between 3% and 16% of their total budgets on interconnection and withdrawn projects 10% to 40%.
The onshore wind numbers were particularly skewed by ISO-NE, where nearly all proposals since 2018 have withdrawn after facing huge interconnection costs that run up to $800/KW, LBNL’s Julie Kemp said.
“For onshore wind, all of the recent projects are located in Maine, and many of them are in quite remote areas where the existing transmission system is pretty limited,” said Kemp. “And, so, these high costs that we see are the result of the significant buildup that would be required to connect substantial new generation in these areas that currently do not have much load or much generation.”
An LBNL graphic showed the highest interconnection costs for wind in Aroostook County in the state’s far north, where the limited transmission system is not even operated by ISO-NE, but rather the Northern Maine Independent System Administrator.


