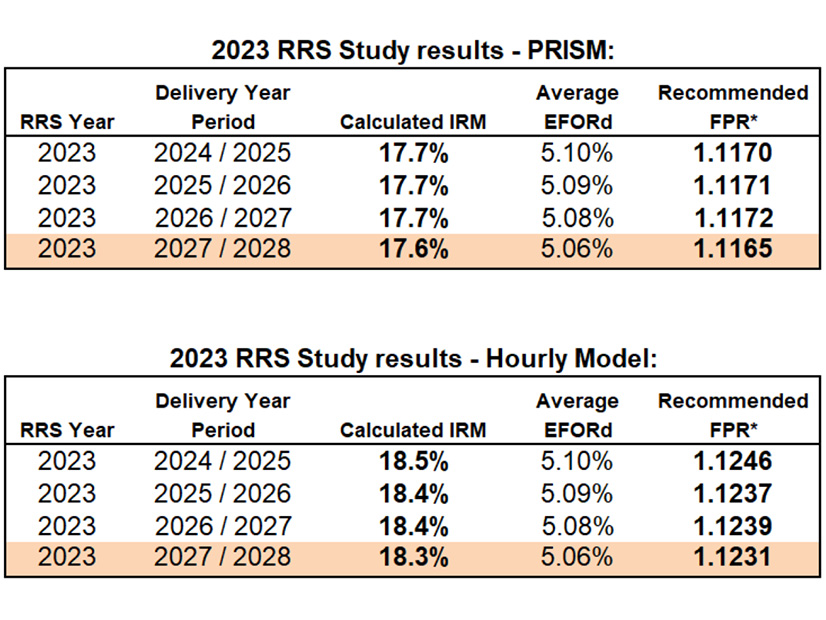
Reserve margins would increase significantly based on the preliminary 2023 Reserve Requirement Study (RRS) results PJM presented to the Resource Adequacy Analysis Subcommittee (RAAS) on Aug. 29.
The installed reserve margin (IRM), which sets the targeted capacity level above expected loads, would rise from 14.7% for the 2026/27 delivery year (DY) in the 2022 study to 17.6% for the 2027/28 DY using PRISM modeling software. The forecast pool requirement, which considers forced outage rates, also would increase from 9.18% to 11.65% for the corresponding DYs.
When comparing RRS results, PJM looks at the furthest year out, as that would be the year a Base Residual Auction (BRA) would be run under a three-year advance auction schedule. (See “Stakeholders Endorse 2022 Reserve Requirement Study Results,” PJM PC/TEAC Briefs: Oct. 4, 2022.)
This year’s study also engages in a second analysis using software developed to perform hourly loss-of-load modeling used in effective load-carrying capability (ELCC) studies to calculate the IRM and FPR. Both results will be presented to stakeholders, who will be asked to endorse one of the sets of results.
The hourly analysis yielded an IRM of 18.3% for the 2027/28 DY and 12.31% FPR, with much of the difference between the PRISM values arising from the load model.
In addition to setting an initial IRM and FPR value for the 2027/28 DY, the study resets the figures for the previous three years. The preliminary results would be increased by a similar margin for each of those years.
PJM’s Patricio Rocha-Garrido said the drivers of the higher margins in the preliminary results are increased uncertainty in the peak load forecasts in the data and a higher generation forced outage rate in the winter owing to the December 2022 winter storm and the November 2013 polar vortex being included in the data. Shifting to hourly modeling of peaks also increased the expected peaks.
Minimal coincidence between the PJM peak load period and the “world” peak — which is defined as MISO, NYISO, TVA and VACAR — led to the capacity benefit of ties (CBOT) value more than doubling to 2.2% from the 1% value in the 2022 study. To reduce volatility, PJM elected to average the CBOT values from 2017-22 and use that figure, which landed at 1.5%, instead.
While the RTO opted to shift the world peak to not fall on the same week as PJM’s peak in the load model, spokesperson Jeff Shields noted that a similar shift was made last year. (See “Stakeholders Endorse RRS Load Model” PJM PC/TEAC Briefs: Aug. 8, 2023.)
“So, shifting the world peak week is not the whole story — the peak load coincidence in weeks other than the PJM peak week, as well as the magnitude of the world peaks on those weeks (as well as during the PJM peak week), also play an important role,” Shields said in an email.
The load model, which included data from 2013-19, contributed to a 2.1-percentage-point increase in the IRM, while the winter peak week caused a 1.1-percentage-point increase under the PRISM modeling. The values were slightly lower for the FPR drivers.
The CBOT contributed to a 0.5-percentage-point decline in the IRM value and 0.58-point-lower FPR.
Under the hourly analysis, the load model contributed to a 3.1-point increase in the IRM and 2.95-point increase in the FPR. The winter peak week increased the IRM by 0.7 points and the FPR by 0.66 points. The CBOT lowered the IRM by 0.5 points, which was about the same for the FPR.
The non-winter peak week had a smaller impact on the IRM under both approaches, 0.2 under PRISM and 0.3 in the hourly model, and had no contribution to the FPR. PJM used a larger amount of data to determine the expected winter peak capacity models, drawing on aggregate outage data from the 2007/08 DY through 2022/23. The remainder of the capacity model data used Generating Availability Data System (GADS) outages from 2018-22.
Rocha-Garrido said PJM is in the process of using coincidental peak distributions to calculate additional values to compare to the PRISM and hourly results to inform staff’s recommendation of which model to use in the final study results.
James Wilson, a consultant to state consumer advocates, said he calculated the PRISM values would lead to around a 3,700-MW increase in the summer reserve margin. Rocha-Garrido agreed that likely would be about right. Wilson questioned what has changed about PJM’s understanding of resource adequacy in the summer to drive such an increase in the amount of capacity that would be procured.
“The explanations just say we made a bunch of changes. … Why are we buying a lot more when we don’t have any reason to think the same isn’t enough?” Wilson said.
PJM’s Andrew Gledhill said staff worked with Itron to improve their load forecast modeling, leading to the hourly approach and an overall modeling which they believe has a tighter fit to the data available. The old modeling appeared to be underforecasting load certainty, in the winter in particular.
Wilson said PJM historically had not included data from the polar vortex in its modeling, believing the issues that led to high forced outage rates during the event had been addressed by winterization efforts. He called on PJM to provide additional analysis justifying the data’s inclusion in the RRS, saying PJM had relied only on the impact of Winter Storm Elliott to make that change.
First reads of the IRM and FPR values are scheduled for the September Planning Committee (PC) and Markets and Reliability Committee (MRC) meetings. The PC is expected to vote on endorsement the following month, while the MRC and Members Committee (MC) are anticipated to vote October through November. The values are expected to be presented to the Board of Managers in December.


