FERC has processed the first round of Order 2023 compliance filings, and the latest round of interconnection queue reforms is being implemented. Some new data indicate the efforts are starting to work.
A recent analysis from consulting firm Wood Mackenzie found that grid operators as a whole in 2024 processed 33% more interconnection agreements than they did in 2023. At the same time, they saw 9% fewer new requests and a 51% increase in withdrawals of non-viable projects. That has helped reduce queue lengths.
Interconnection capacity agreements reached historic highs in 2024, with 75 GW approved. Through July 2025, grid operators had approved an additional 36 GW. That’s on pace to match 2024’s record, Wood Mackenzie said.
The analysis reports that ERCOT’s connect-and-manage approach continues to work, leading to the highest success rates and speed to interconnection in the country. ISO-NE takes second place. Wood Mackenzie notes that the ISO-NE delay from moving serial processing to a new cluster study method means it takes four times as long to sign an interconnection agreement there as it does in Texas.
The Lawrence Berkeley National Lab also recently released a nationwide queue data set, which includes the same kind of data used to develop its “Queued Up” reports in years past. (See IRA Driving New Clean Energy as Interconnection Queue Backlogs Persist.)
LBNL’s data comes from all seven organized markets and an additional 49 non-ISO balancing areas that are home to 97% of installed generation in the country. It includes generation projects seeking to connect to the transmission system (with none seeking distribution level interconnection) through the end of 2024.
The country’s grid operators had 2,290 GW in their queues at the end of 2024, which includes 481 GW of requests made that year. That is down from 2,598 GW overall and 908 GW of new requests in 2023. The number of older projects from previous years continued to grow, but at just 119 GW, it was at the slowest rate so far this decade.
Nationwide, queues set a record for withdrawals (dating back to 2000), with 340 GW of projects pulling out of the process in 2024. That compares with 127.1 GW in 2023 and is well ahead of the previous annual record of 197.1 GW.
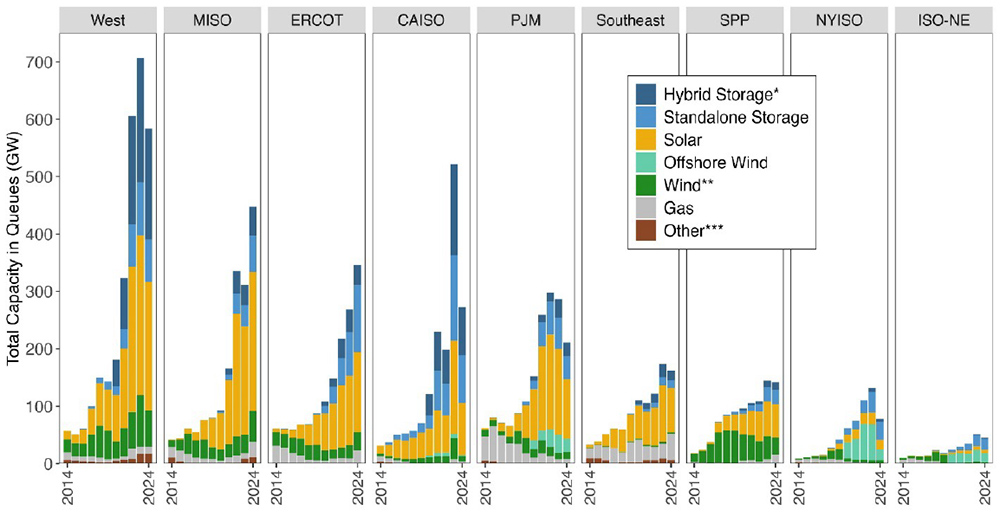
Solar and storage continued to be the two largest technologies seeking to connect to the grid in 2024, but at around 900 GW apiece (including hybrid and standalone projects), both saw the amount in the queues drop from 2023. Natural gas generation is at a fraction of that nameplate capacity, but it saw growth on the year going from 69.4 GW of standalone projects in 2023 to 123.4 GW last year.
Among the ISO/RTOs, MISO had the largest queue at the end of 2024, with 447.5 GW, with just over half of that coming from solar. ERCOT was second at 346 GW at the end of 2024, including 139.4 GW of solar and 116.8 GW of storage.
CAISO had the largest queue by far in 2023, but its line was down by hundreds of gigawatts in 2024 to a still-large 272.9 GW, with storage representing 167 GW (both standalone and hybrid) and solar an additional 90 GW.
While the number of new requests was down overall, the potential capacity in the queue continues to exceed installed capacity, with 2,290 GW in line compared to 1,322 GW of installed capacity.
LBNL reported that most of the projects in the queue hope to connect to the grid by 2028, with 300 GW planning to connect in 2025, 371 GW in 2026, 403.6 GW in 2027 and 429.1 GW seeking interconnection in 2028.
The data LBNL released includes five-year forecasts of demand and retirements compared to advanced projects in the queue with either signed or drafted interconnection agreements. The one region with a major gap between forecast load and new supply is PJM, which is facing significant load growth.