By Michael Kuser
FERC on Monday disclosed data underlying its new formula for setting return on equity rates for New England transmission owners (NETOs) and explained how the data influenced the ROE methodology outlined in an October 2018 briefing order.
But the commission’s Jan. 7 order also noted it had not yet made any final determinations and referred complainants to the paper hearing on the issue (EL11-66-001, et al.).
The release of information came in response to a Nov. 16 motion for expedited disclosure by a coalition consisting of Connecticut’s utility regulator and New England power cooperatives. The group sought the data and analyses underlying two graphs the commission referenced in its decision to no longer rely solely on the discounted cash flow (DCF) model but give equal weight to results from the DCF and three other techniques: the capital asset pricing model (CAPM), expected earnings model and risk premium model. (See FERC Changing ROE Rules; Higher Rates Likely.)
The Connecticut Public Utilities Regulatory Authority, Eastern Massachusetts Consumer Owned Systems, Massachusetts Municipal Wholesale Electric Company and New Hampshire Electric Cooperative asked the commission to “identify and, where not already in the record in these four proceedings, release the sources, data sets, and analyses underlying Figure 2 and Figure 3 in its October 16 Order.”
The commission’s new policy came in its long-awaited response to the D.C. Circuit Court of Appeals’ April 2017 ruling vacating FERC’s 2014 order on the NETOs’ ROE rates. (See Court Rejects FERC ROE Order for New England.)
Data Details
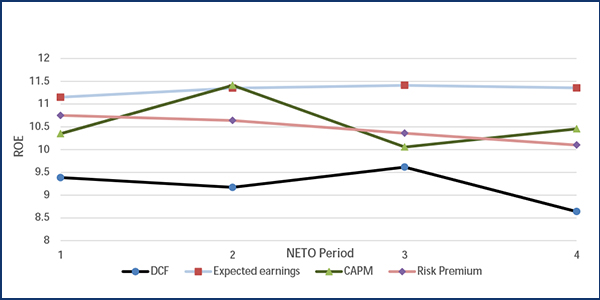
The Monday order said that Figure 2, “ROE Results from ROE Models,” shows the ROE results from the four models over the four test periods at issue in the proceeding and that in calculating the expected earnings midpoint for Period 2, it had excluded ITC Holdings and Wisconsin Energy from the proxy group “as high-end outliers because their ROEs were more than 150% of the proxy group median for the NETOs,” which was 10.225%.

ITC Holdings was similarly excluded from the proxy group for Period 3, as was CenterPoint Energy for Period 4. The commission listed all other data effects as “none,” except for its CAPM ROE midpoint, which had been rounded up in Figure 2 to 10.46% from 10.45%, as its exact midpoint is 10.455%.
The motion for disclosure said, “Figure 3, which is titled ‘Regulated Utilities PE Chart’, appears to be excerpted from a report generated by Evercore ISI, an investment banking advisory firm. This report is not in the record for these proceedings and appears from our research to be proprietary and not publicly available.”
The commission responded that Evercore ISI produced Figure 3 and that it “does not have access to the data or analyses that were used to produce that chart and therefore cannot provide that information. The Briefing Order relied on Figure 3 only for the limited purpose of showing that there had been a substantial increase in utilities’ price to earnings ratio during the period [of] October 2012 to December 2017.”

Figure 3 was part of the briefing order’s explanation of why, during that period, “utility stock prices appeared to have performed in a manner inconsistent with the underlying premise of the DCF model that an investment in common stock is worth the value of the infinite stream of dividends discounted at a market rate commensurate with the investment’s risk,” said the commission.
Moreover, the commission said it did not rely on Figure 3 for any final determination on the use of the DCF model to determine utility ROEs.