
By Jason Fordney
Electric system disturbances resulting from the loss of generation or transmission in the U.S portion of the Western Interconnection increased by 50% between 2015 and 2016, according to a new report from the Western Electricity Coordinating Council.
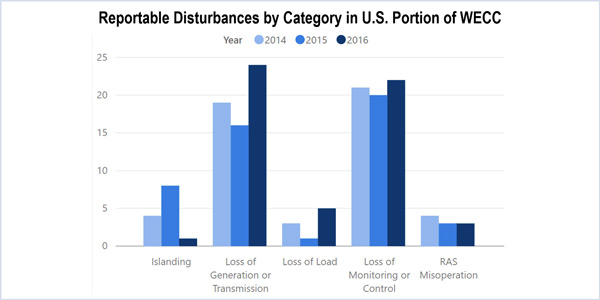
There were 24 “loss of generation or transmission” events in 2016 compared with 16 in 2015, WECC said in its State of the Interconnection report. The category refers to the loss of three or more Bulk Electric System facilities from a common cause, or the loss of 2,000 MW or more of generation.
WECC did not provide detail on the reason for the increase and did not immediately respond to a request for more information.
Loss-of-load events in the interconnection also increased between 2015 and 2016, from one event to five. These events are defined as loss of firm load for 15 minutes or more exceeding 300 MW for entities with demand of 3,000 MW or greater in the previous year, or exceeding 200 MW for all other entities. There were three loss-of-load events in 2014.
The largest loss of load occurred Aug. 7, with the loss of 665 MW, about 0.5% of the day’s peak system demand of about 127,000 MW.
Not all bulk power system disturbances qualify as loss-of-load events, and “relatively few meet the criteria,” WECC said.

Noting the increase, WECC said that “more years of data will be necessary to determine whether this signifies an increasing trend and potential concern, a statistical anomaly or normal variation between years.”
“Loss of monitoring or control” events — those lasting 30 minutes or more that affect an entity’s ability to make operational decisions — also increased in the Western Interconnection last year. There were 20 such events in 2015 and 22 in 2016.
Islanding events — unintentional system separation resulting in an electrical island of 100 MW or more — dropped from eight in 2015 to just one in 2016.
Incidents in which a remedial action scheme failed or was enacted unnecessarily dropped from four in 2014 to three in 2015 and 2016.
The Western Interconnection housed a combined nameplate generation capacity of 267,000 MW in 2016, up 1% from the previous year. Natural gas-fired generation represented the largest share (40%), followed by hydroelectric (27%), coal (14%) and wind (8%), with the balance coming from solar, geothermal, nuclear and “other” utility-scale generation.

In 2016, “retirement of coal and steam turbine gas units led to slight decreases in capacity from these fuel types, while the installed capacity of utility-scale solar increased by over 6,000 MW,” WECC said. There is about 14,350 MW of solar in the interconnection, or about 5% of capacity.
Hydro dominates in the Northwest, while California and the Southwest are heavy with natural gas. Solar capacity is growing in California, and wind capacity is increasing in the Rocky Mountains and along the Columbia River.
WECC is the regional entity responsible for compliance monitoring and enforcement in the Western Interconnection, which spreads west from the Rocky Mountains to California, north into western Canada and south to Mexico’s Baja California Peninsula. It consists of 37 balancing authorities and is one of four major interconnections across North America. The WECC report covers the bulk power system, which does not include local electric distribution systems.
The WECC Board of Directors is due to receive an update regarding the State of the Interconnection report at its June 21 meeting in Salt Lake City.


