Capacity prices in most of PJM dropped by nearly two-thirds for 2022/23.
| PJMCapacity prices in PJM fell sharply for delivery year 2022/23, the RTO announced Wednesday, with rest-of-RTO prices dropping by nearly two-thirds to $50/MW-day and prices in the Eastern and Southwest Mid-Atlantic Area Council (MAAC) regions falling to their lowest on record.
Nuclear generators, natural gas, renewables and energy efficiency increased their market share, while coal saw its contribution shrink.
Overall, the Base Residual Auction, held May 19 to 25, cleared 144,477 MW of resources for the June 1, 2022, through May 31, 2023, delivery year, at a cost of $3.9 billion. That is $4.4 billion less than the 2018 auction for 2021/22, after adjustments for an increase in those choosing to skip the auction by using the fixed resource requirement (FRR). The auction gives PJM a 19.9% reserve margin, above the 14.5% requirement, including load and resource commitments under FRR.
Prices in five areas — ComEd ($68.96), Duke Energy Ohio and Duke Energy Kentucky ($71.69), MAAC ($95.79), Eastern MAAC ($97.86) and Baltimore Gas and Electric (BGE) ($126.50) — cleared above the overall PJM price.
The MAAC region comprises Atlantic City Electric, BGE, Delmarva Power, Jersey Central Power & Light, Met-Ed, PECO Energy, Penelec, Pepco, PPL, Public Service Electric and Gas, PPL and Rockland Electric. The Eastern MAAC region is Atlantic City Electric, Delmarva, JCP&L, PECO, PSE&G and Rockland Electric.
The 2021 results continued the historical year-to-year price volatility. Prices in most of the RTO had cleared at $140/MW-day in 2018, an 83% increase from the year before. (See Capacity Prices Jump in Most of PJM.)
Load Forecast, CONE, Tx Capacity Cited
Stu Bresler, PJM’s senior vice president of market services, said the drop resulted from a lower load forecast, a reduction in the net cost of new entry (CONE), increased transmission capacity into constrained locational deliverability areas (LDAs) and lower offer prices.
PJM said net CONE was down 19% for the RTO and 28% in the ComEd LDA. Net CONE “anchors the demand curve,” he said. The lower load forecast and the increased transmission capacity in LDAs shifted the demand curve to the left.
“If you combine a shift down and to the left of the demand curve and a downward shift in the supply curve, those two conditions together will result in lower prices,” he said.
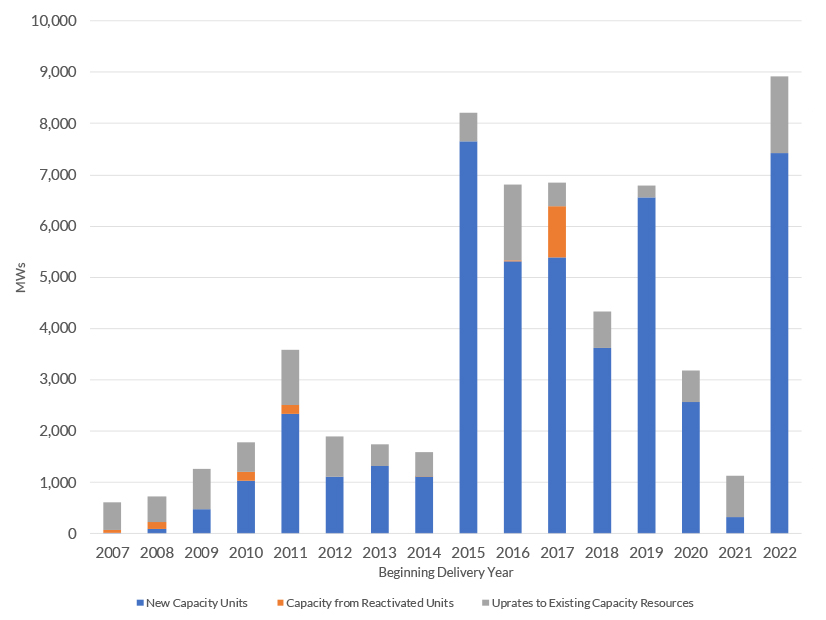
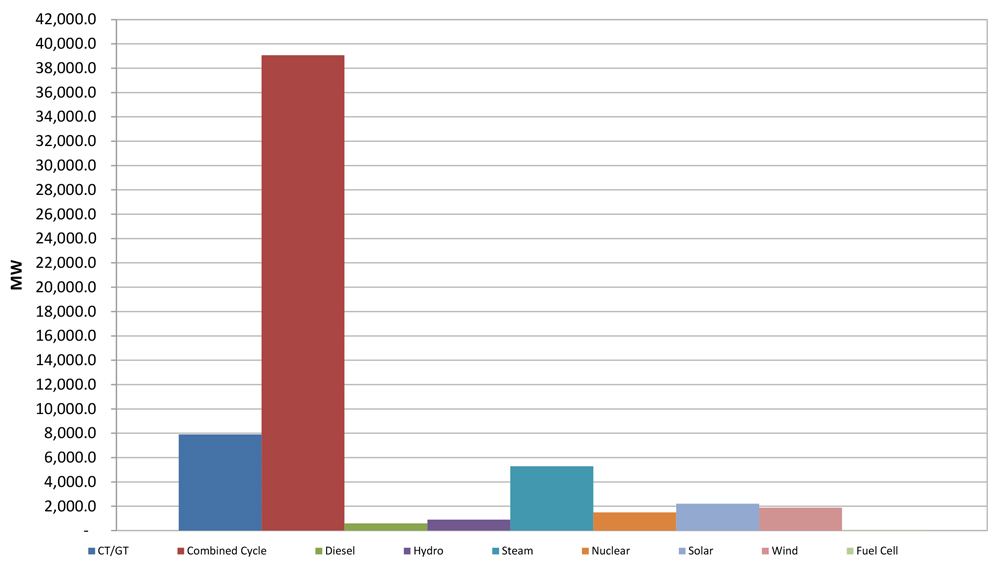
Wind resources cleared 1,728 MW (an increase of 312 MW over 2018) while solar cleared 1,512 MW (+942 MW), increasing the RTO’s total nameplate capacity for those resources to 11,761 MW.
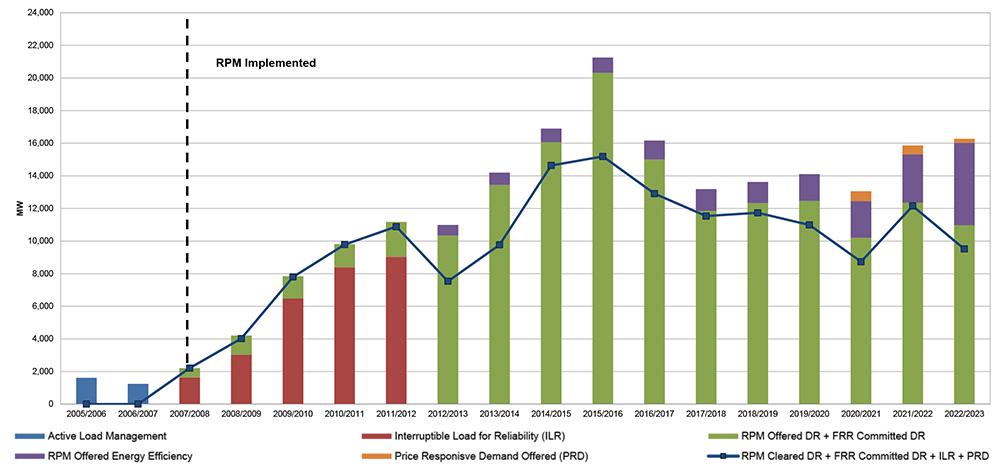
Energy efficiency rose by 1,979 MW (70%), while demand response declined 2,314 MW (-21%) to 8,812 MW.
Bresler said the drop in DR may have been caused in part by the one-year gap between the BRA and the delivery year, rather than the normal three-year forward period. “It seems to have been a trend in the past for demand response providers to … offer demand response on the basis of an ability to sign customers up between when the auction clears and the delivery year starts. So part of the effect here could be due to the fact that we are so much closer to the start of the actual delivery year, which limited the opportunity to adjust the portfolio through the incremental auctions.”
Combined-cycle gas plants added 3,414 MW and nuclear increased by 4,460 MW, adjusted for FRR elections. Cleared coal generation dropped by 8,175 MW, adjusted for coal units committed to FRR plans.
Dominion Energy Virginia chose the FRR option beginning with this year’s BRA over concerns an expanded minimum offer price rule (MOPR) would undermine its ability to meet Virginia’s renewable energy targets. The utility’s FRR election covered more than 60 generating units totaling more than 18.1 GW, including its 1.7-GW Surry nuclear power plant. All told, 175 generating units chose the FRR for this BRA, the second highest on record and more than double the 85 units that chose the FRR option for 2021/22. (See Dominion Opts out of PJM Capacity Auction.)
MOPR Impact
The 2022/23 auction, originally scheduled for 2019, was canceled by FERC after the commission ordered the RTO to expand its MOPR to state-subsidized resources. (See FERC Halts PJM Capacity Auction.) PJM will hold its next BRA, for 2023/24, in December.
Bresler said the impact of the expanded MOPR appeared to be modest.
“I can tell you there were some resources that were subject to the MOPR that did not clear in the auction. It’s very difficult to say whether or not they would have cleared but for the MOPR because we don’t know what they would have offered in the auction,” he said. “It’s hard for us to know some of these causes because we don’t have a whole lot of insight into the market sellers’ offer behavior.”
“However, when you look at the pricing results from this auction, together with the fact that there were significant increases in wind and solar and committed nuclear resources, it’s hard to see how the MOPR had any significant or large impact on this auction. That’s really what we expected.”
The expanded MOPR was ordered by FERC in December 2019 under then-Chair Neil Chatterjee, a Republican. But at a FERC technical conference in March, new FERC Chair Richard Glick, a Democrat, and PJM CEO Manu Asthana both said the MOPR is not “sustainable” because it is frustrating state decarbonization efforts.
In April, PJM proposed FERC take responsibility for determining what resources are subject to MOPR, rather than having the RTO and the Independent Market Monitor make such decisions. (See PJM Proposes Shifting MOPR Determinations to FERC.)
P3 Protests PJM MOPR Plan
On June 1, the PJM Power Providers Group (P3), which represents owners of 67 GW of capacity, wrote a letter to the RTO’s Board of Managers lambasting PJM’s position.
“While P3 generally would not offer a letter to the PJM board about a stakeholder matter that is still being actively discussed in the stakeholder meetings, the PJM-proposed revisions to the minimum offer price rule (MOPR) are so ill-conceived and completely incompatible with FERC’s authority and PJM’s mission that our organization feels compelled to bring certain matters to the board’s attention at this time,” P3 wrote.
It called PJM’s proposal “legally flawed” and “a dramatic departure from many of its foundational principles.
“PJM’s proposal starts with the unsupported premise that PJM can take no action to preserve a competitive market outcome if that action could be viewed as interfering with a state policy. From there, PJM’s current proposal puts forth a complete retreat from the notion of a competitive capacity market and instead sets up a market design that will allow subsidies rather than market signals to dictate market exit and entry.
“P3 is increasingly questioning whether PJM continues to believe in the promise of markets or if other priorities have supplanted this historical priority of the organization,” it added, urging the board to “communicate clearly to PJM management that the organization remains committed to markets and expects to review a MOPR-related proposal that is consistent with PJM’s historical commitment to competitive capacity markets.”