 Steve Huntoon | Steve Huntoon
The latest rage in green electricity procurement is hourly matching of carbon-free (green) supply with customer load.[1] The impetus is recognition that the standard practice of annual matching involves non-green generation to balance supply and load throughout the year. This seemingly simple “next frontier”[2] in procurement is anything but simple.
Some Background
By way of background, let’s recall that no consumer physically gets a given supply of electricity. The grid is akin to a giant swimming pool with thousands of hoses dumping water in (generation) and millions of hoses taking water out (consumers). The grid operator is charged with maintaining the water level (balancing). No one physically gets water from a specific water hose.
This is a crude analogy because, among other things, when it comes to electricity, no one gets anything physical at all (matter) — not even electrons, which don’t actually move.[3] Instead generators supply electric energy, and that’s what consumers use. With me so far?
So when a consumer buys green electricity, it’s basically getting a contract commitment of some form that X megawatt-hours of green electricity are generated by the seller, and the seller hasn’t sold these green attributes elsewhere.[4]
With annual matching there is total annual green generation equal to total annual consumer load. But because of large differences between generation and load throughout the year, the grid operator has to procure and deliver other generation when that green consumer’s load exceeds the green generation. And when green generation exceeds the green consumer’s load, the excess is delivered to other consumers (or curtailed).
Now consider this situation with hourly matching instead of annual matching. Every green consumer has to pay the cost of covering its hourly load with green supply. Each hourly load has to be covered from some combination of green generation and storage. The extra green generation to cover peak hours will be under-utilized during other periods, and storage, especially long-duration storage, is hugely expensive, so the cost of this hourly matching is huge.[5]
Proponents of this “next frontier” of hourly matching vis-à-vis annual matching say that the former incents much more actual green generation because of the basic phenomenon described above. But there are multiple problems with this vision — as we shall see.
Hourly Matching Is an Irrational Way to Reduce Emissions
The incremental cost of hourly matching versus annual matching is many times greater than the incremental green generation from hourly matching versus annual matching. The modeling by the proponents of hourly matching shows this.
If you look at this emissions reduction chart for annual matching versus hourly matching, you’ll see that annual matching for the sample participation rate in California modeling yields 2.4 million tons/year, compared with 5.7 million tons/year for hourly matching, a ratio of 2.4 to 1.[6]
 Jesse D. Jenkins
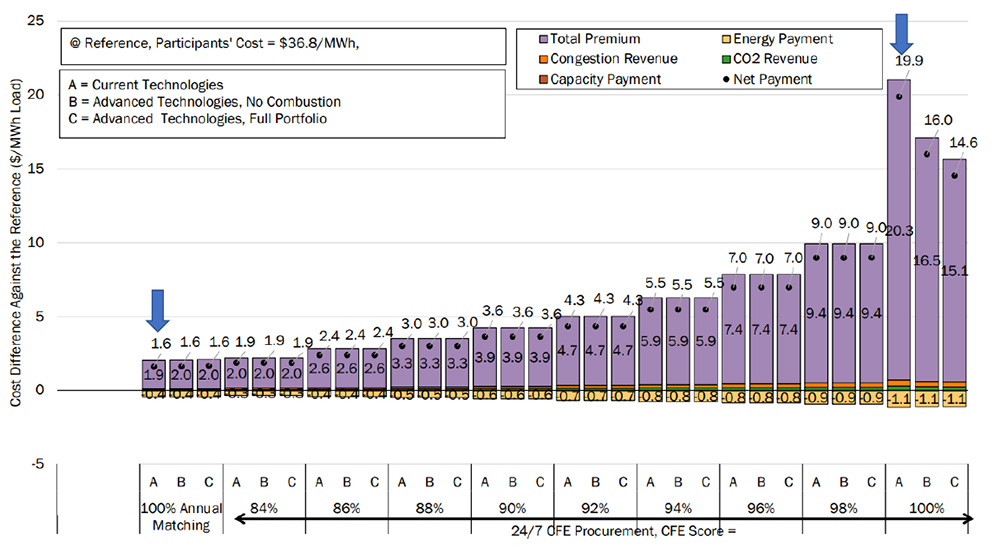
And now if you look at the cost premium chart for annual matching versus hourly matching, you’ll see that annual matching has a cost premium of $1.60/MWh, compared with a $19.90/MWh cost premium for hourly matching, a ratio of 12.4 to 1.[7]
Jesse D. Jenkins
So, instead of spending more for hourly matching, the green customer should use extra dollars for more annual green purchases.[8] The same dollar creates much more emissions reductions when spent on annual matching instead of hourly matching.
The Premises for Hourly Matching Are Wrong
Proponents of hourly matching presume that this consistently matches green generation with load. This is not the case for at least three reasons.
An hour is unpredictable, arbitrary and wrong. Proponents of hourly matching presume that within any given hour the green generation is matching the green consumer’s load. Of course a typical consumer’s load fluctuates widely; can a given consumer accurately forecast its load hour-by-hour and then communicate that to a generator such that the generator tracks that forecast with its output?
 Wind power forecast and actual wind power values, for one day, in five-minute intervals | Pacific Northwest National Laboratory
And even where the consumer’s load tends to be flat (such as at a data center), green generation is not. This is illustrated by wind generation data for a typical balancing authority (region) for five-minute intervals.[9] You can see that wind generation varies greatly among 12 five-minute intervals comprising an hour.
If hourly matching is used, load will be matched to the average of the 12 five-minute intervals. During any given five-minute interval when load exceeds wind generation, other resources will be dispatched to cover the difference. And, similarly, when load is less than wind generation, the excess will be delivered to other consumers.
Just like annual matching!
Location, Location, Location
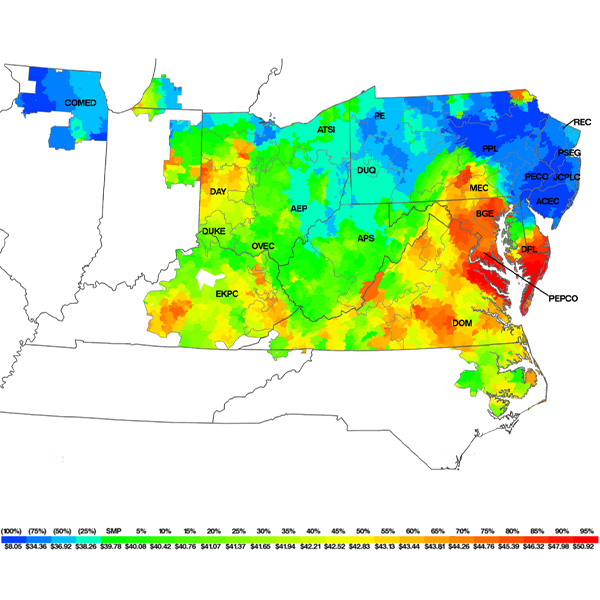
PJM real-time load-weighted average LMP for 2021 | Monitoring AnalyticsTo further complicate matters there is the stumbling block of transmission constraints throughout the grid. In PJM for example, there are thousands of such constraints which, by definition, keep lower-cost energy from reaching load (aka “congestion”). This happens all the time all over PJM and is indicated by higher energy prices in constrained areas.[10] This map of varying energy prices in PJM illustrates the phenomenon.[11]
Now let’s consider a consumer inside a transmission-constrained area for a given hour. If the consumer’s green supply is on the other side of the constraint, then that green supply does not supply that consumer. Other generators, inside the transmission-constrained area, are being dispatched to supply that consumer (and other load within the constrained area).
The proponents of hourly matching say that generators and consumers will be grouped together by “the same electricity grid region,”[12] thus ignoring these transmission constraints.
Marginal Emissions
If things weren’t complicated enough, unless and until all non-green resources are eliminated from the grid, there is the nagging problem of marginal emissions. These come from the last (most expensive) resources dispatched to meet demand at any given point in time. And they typically would be fossil fuel resources because of their higher variable cost than green resources.
If we take a consumer that has an hourly matching supply arrangement, it can point to a matching green supply for its hourly load. But the sheer presence of its hourly load could cause the marginal resource to be fossil fuel instead of green. Now this consumer could argue that this is not the right “but for” test because without its load it wouldn’t be providing the green supply, and therefore the marginal fuel would be fossil fuel in any event.
But then again, once the green generation exists it would run regardless of whether it’s part of the supply committed to that consumer. So whether hourly matching always causes zero emissions (putting aside the arbitrary hour and transmission constraint issues discussed above) is somewhat of a metaphysical question.
Wrapping Up
Hourly matching is wasteful, and the premises for it are wrong. The climate challenge is tough enough without wasting money.
Columnist Steve Huntoon, principal of Energy Counsel LLP, and a former president of the Energy Bar Association, has been practicing energy law for more than 30 years.
[1] An entire conference was devoted to this and related subjects in December, http://www.raabassociates.org/main/roundtable.asp?sel=166. Only proponents — no skeptics — were on the panels. There is a federal executive order that requires 50% of federal electricity by 2030 to be “24/7 carbon pollution-free electricity,” https://www.whitehouse.gov/briefing-room/presidential-actions/2021/12/08/executive-order-on-catalyzing-clean-energy-industries-and-jobs-through-federal-sustainability/, section 102(i).
[2] http://www.raabassociates.org/Articles/Jenkins%20Presentation%2012.9.22.pdf (hereafter “Jenkins Presentation”).
[3] “Energy is transmitted, not electrons. Energy transmission is accomplished through the propagation of an electromagnetic wave. The electrons merely oscillate in place, but the energy — the electromagnetic wave — moves at the speed of light. The energized electrons making the lightbulb in a house glow are not the same electrons that were induced to oscillate in the generator back at the power plant.” -Brief Amicus Curiae of Electrical Engineers, Energy Economists and Physicists, at 2, New York v. FERC, 535 U.S. 1 (2001), https://www.findlawimages.com/efile/supreme/briefs/00-568/00-568.mer.ami.engineers.pdf
[4] The green contract commitment can be in the form of Renewable Energy Certificates (RECs) or a power purchase agreement with a green generator. More here, https://www.ftc.gov/sites/default/files/attachments/press-releases/ftc-issues-revised-green-guides/greenguides.pdf, section 260.15.
[5] For example, RMI presents study data indicating that low hourly matching (0-10%) costs around $50/MWh while higher hourly matching (70-80%) costs more than $200/MWh — and that’s not close to full hourly matching. http://www.raabassociates.org/Articles/Final%20Dyson%20Presentation%2012.9.22.pdf, slide 10.
[6] Jenkins Presentation, slide 8, with annual matching and hourly matching under current technologies noted by arrows.
[7] Jenkins Presentation, slide 10, with annual matching and hourly matching under current technologies noted by arrows.
[8] This can be done by simply purchasing more RECs, or by over-procurement in a PPA with sale of the excess overload into the grid.
[9] https://www.pnnl.gov/main/publications/external/technical_reports/PNNL-19229.pdf, Figure 6.1 on page 6.4.
[10] For exhaustive detail on this phenomenon, please see the most recent State of the Market report here, https://www.monitoringanalytics.com/reports/PJM_State_of_the_Market/2021/2021-som-pjm-sec11.pdf
[11] https://www.monitoringanalytics.com/reports/PJM_State_of_the_Market/2021/2021-som-pjm-sec3.pdf, Figure 3-44 on page 174. A map showing zonal prices in real time is on the PJM home page.