, continuing the RTO's history of volatility. The auctions resulted in a single \"rest of pool\" price except for FCA 15 and 16, when regions priced separately.")
ISO-NE's capacity prices cleared at $3.58/kW-month in FCA 18, a nearly $1 increase over last year.
[Editor’s Note: This story was updated to correct some details of the capacity awards.]
ISO-NE’s capacity market continued its rollercoaster ride as prices for Forward Capacity Auction 18 rose to $3.58/kW-month, a nearly $1 increase (38%) over last year and the second highest “Rest-of-Pool” price since FCA 13.
The RTO, which completed the auction after four rounds of bidding on Feb. 5, filed its results for FERC approval Feb. 21 (ER24-1290). The RTO asked FERC to set a deadline of April 8 for comments.
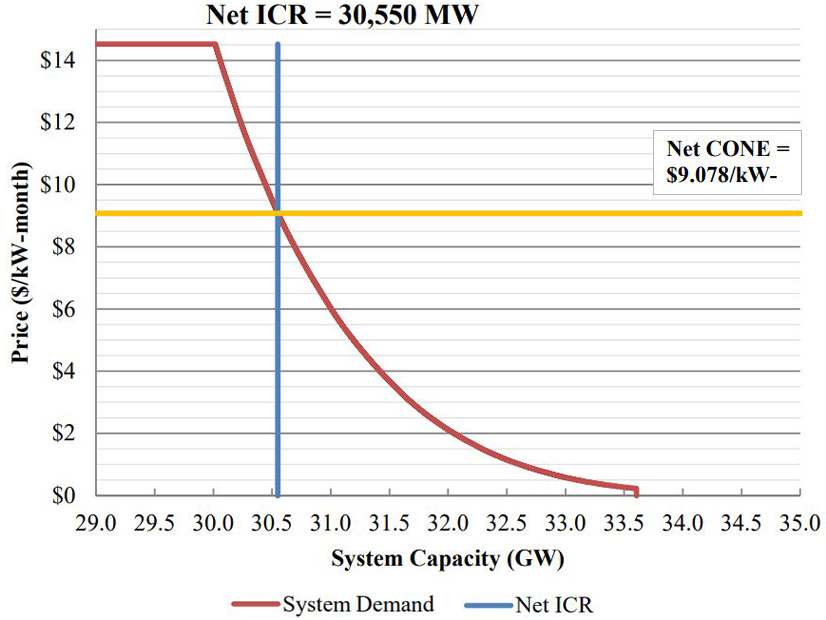
The auction for the June 1, 2027-May 31, 2028, delivery year procured 31,556 MW of capacity — slightly above the 30,550-MW net installed capacity requirement (ICR) — from about 950 resource obligations, ranging from 7 kW (Sunnybrook Hydro 2) to the Seabrook and Millstone Point Unit 3 nuclear plants at 1.2 GW each. The capacity will cost ratepayers about $1.3 billion.
Last year, prices cleared at $2.59/kW-month in all zones and import interfaces except for the New Brunswick interface, which cleared at $2.551. (See FCA 17 Shows Clean Energy Boost, Endgame for Coal in New England.)
ISO-NE’s calculation of the quantity of capacity procured is based on the amounts for June 2027. Among fuel types, natural gas led with 13,817 MW (44% of the total), followed by fuel oil and nuclear at 11% each, and hydropower at 10%.
Demand response contributed 2,614 MW (8%), followed by electricity used for energy storage (5.8%)
Solar (2.2%) and wind (1.7%) trailed kerosene at 3%, although their combined total of 3.9% was up from about 3% in last year’s auction.
Imports contributed 1.5%.
New resources represented 1,484 MW, 4.7% of the total, including 741 MW of storage, 185 MW of wind and almost 53 MW of solar.
In total, the RTO said, emissions-free renewable generation, storage and demand resources contributed about 40% of the total at almost 1,085 MW.
Zones
The auction set separate zones for Northern New England (New Hampshire, Vermont and Maine load zones), Maine (modeled as a nested export-constrained zone within NNE), and the Rest-of-Pool.
The ROP included Southeastern Massachusetts, Rhode Island, Northeastern Massachusetts/Boston, Connecticut and Western/Central Massachusetts.
The descending clock auction started in each zone at $14.525/kW-month, resulting in a clearing price of $3.58/kW-month for all zones and imports over the New York AC ties (122.89 MW), New Brunswick external interface (70 MW), Hydro-Québec Highgate external interface (18.17 MW) and the Phase I/II HQ Excess external interface (253.78 MW).
There were no active demand bids for the substitution auction and the RTO did not reject any retirement delist bids for reliability reasons.