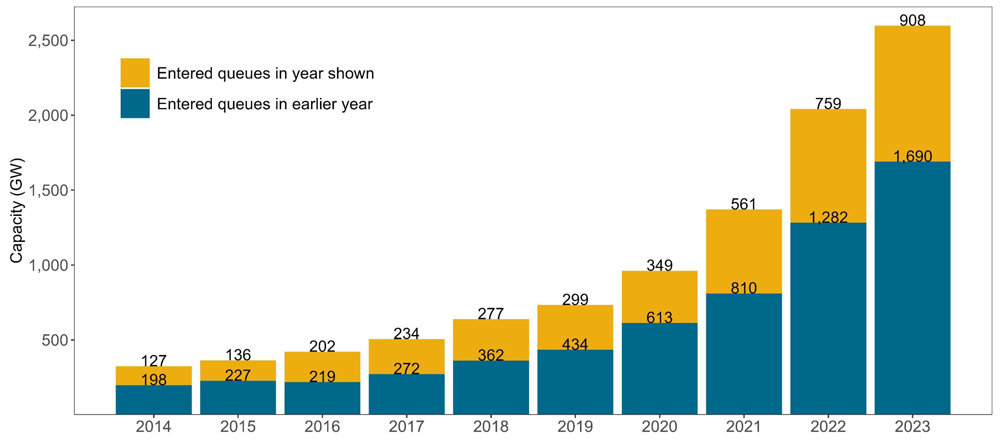
Interconnection requests across the U.S. shot up by 30% in 2023, with close to 2,600 GW of solar, wind and storage waiting to land a spot on the grid, according to the Lawrence Berkeley National Laboratory’s 2024 Queued Up report.
This year’s edition of the lab’s annual tally of projects awaiting interconnection provides a granular look at the conflicting forces — regulatory, economic and logistical — affecting projects sitting in the queues of the nation’s seven RTOs and ISOs and 44 other balancing authorities in non-RTO/ISO regions.
On the one hand, the report notes, renewable energy tax credits in the Inflation Reduction Act have had a significant impact on project development, providing tailwinds for over 1,200 GW of new projects that have applied for interconnection since the law was passed in August 2022.
“Although not all of the post-IRA interconnection requests can be attributable to the IRA, these provisions increased developer interest in clean energy, and the queues are one indicator of this,” the report says.
But even with FERC Order 2023, aimed at reforming interconnection processes, existing backlogs may take one to two years or more to clear. Several RTOs and ISOs have either paused applications or are considering doing so until they can implement the order.
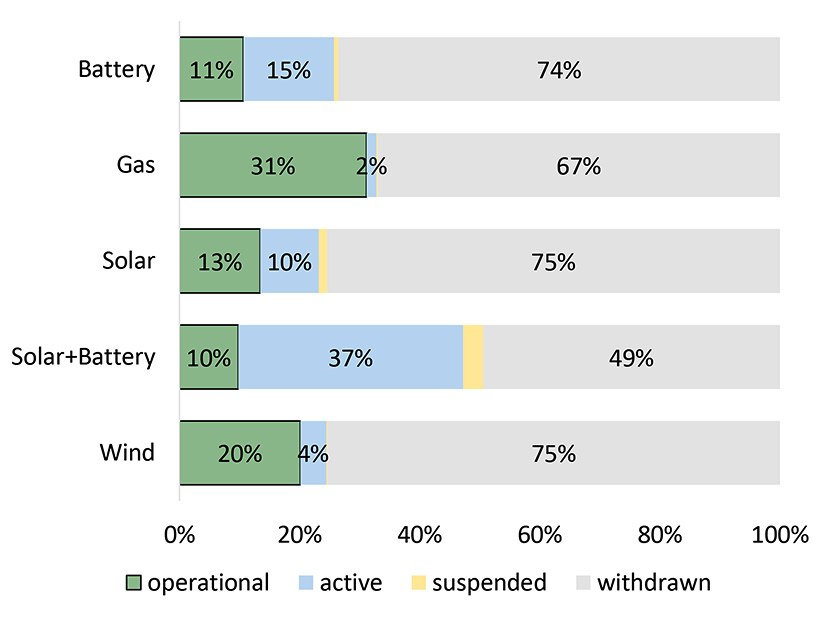
These backlogs’ impact — along with other permitting obstacles, supply chain delays and high interest rates — can be seen in the more than 70% of interconnection requests withdrawn between 2000 and 2018, the most recent figures available. During that time, only 20% of wind projects requesting interconnection went online, with solar scoring 13% and battery projects 11%.
The Berkeley report also drills into the withdrawal stats to track when in the interconnection process they were withdrawn ― during initial feasibility or system impact studies, or later during the facility studies or interconnection agreement negotiations. Generally, most withdrawals occur in the early stages, but the report found an increasing trend toward late-stage withdrawals from 2016 to 2018.
Such late-stage withdrawals can cause a snowball effect, the report says, causing sunk costs and lost deposits for developers while triggering restudies for other projects in the queue.
Withdrawal rates for standalone solar, wind and battery projects were higher than for hybrid projects. While standalone projects each had a withdrawal rate of about 75%, the rate for hybrid projects was 49%.
Size, Location Matter
The number of gigawatts now sitting in queues is more than twice the 1,279 GW currently online across the country, the report says, and almost all RTOs and ISOs could add more than enough new power to cover peak demands and expected demand growth.
“Some people are saying, ‘We have so much more capacity in the queue that we really have a need for,’” said Joseph Rand, energy policy researcher at the Berkeley Lab. But with new data centers, electric vehicles and manufacturing coming online, “there’s a real need to bring online new electric generation,” he said.
The slowdown in new interconnection requests in MISO and PJM has been more than offset by a boom of new capacity going into queues in CAISO and the non-ISO West, the report says. CAISO’s queue exploded in 2023, going from about 200 GW in 2022 to 523 GW of solar, storage and hybrid storage projects.
The non-ISO West saw its queues add about 100 GW, also of solar, storage and hybrid resources; the region now leads the country with 706 GW awaiting interconnection.
The size of projects is also increasing, with solar projects now averaging 193 MW, a 250% increase since 2015, while battery projects are averaging just over 200 MW, a 330% increase since 2015.
But along with all that increased capacity and number of interconnection requests, the report also found longer timelines for projects to cycle through the process. For projects going online in 2023, the typical time from interconnection request to start of operation was close to five years, compared to three years in 2015 and less than two years in 2008.
Timelines are also affected by project size, the report says. Projects under 5 MW can go from interconnection request to operation in about 20 months; for midsized projects of 5 to 20 MW, the time is 33 months, and for larger projects 100 to 200 MW and up, it’s four to 4.5 years.
On average, CAISO takes the longest to get projects from interconnection request to operation — an average of seven years or more — followed by NYISO and SPP, at five to six years, the report says. The non-RTO Southeast and ISO-NE have the shortest timelines, three and two years, respectively.
Rand cautioned that interconnection is one of a range of factors affecting project timelines, such as securing offtake agreements and local permitting, along with supply chain delays.
‘Chipping Away’
With RTOs and ISOs still formulating their plans for implementing Order 2023, significant change in interconnection processes and timelines will likely be incremental, Rand said.
He sees RTOs and ISOs facing “countervailing forces that are almost working against each other.” The “absolute splurge of developer interest in new clean energy … [and] an unprecedented volume of new requests [is] overwhelming the system” while the changes by FERC and the RTOs are only “chipping away” at the backlog, he said.
“We’re hitting this point where we’re in need of more innovative reforms that are maybe a little bit more comprehensive, and they revamp things a little more deeply,” Rand said, pointing to more automation as an example. Most stakeholder sectors “seem to recognize that FERC Order 2023 is just a baseline, and more needs to be done.”
Rand is hoping FERC’s forthcoming rule on transmission planning will make a bigger dent. “I really look forward to doing this report next year,” he said.