The topline figures from EPA’s new inventory of U.S. greenhouse gas emissions from 1990 to 2022 ― released April 11 ― show the country’s slow and uneven progress toward President Joe Biden’s goal of cutting emissions by 50 to 52% below 2005 levels by 2030.
The U.S. has cut its greenhouse gas emissions by a modest 16.7% since 2005, and in 2022, total GHG emissions edged up 1.3% over 2021 levels as the economy continued to rebound from the COVID-19 pandemic, the report says.
Carbon dioxide accounted for 80% of the country’s 5,489 million metric tons (MMT) of GHG emissions in 2022, with 93% of that coming from the burning of fossil fuels.
In second place, methane emissions accounted for 11%, with 27% of that produced by farm animals ― cows, sheep and goats ― and 25% from natural gas infrastructure. Methane has 28 times the global warming potential of CO2.
The remaining 9% came from a mix of lesser GHGs, all with high global warming potential. Nitrous oxide, which makes up 6% of total emissions, has a global warming potential 265 times higher than CO2.
EPA compiles the report annually to be submitted to the U.N. Framework Convention on Climate Change by April 15, the deadline for developed countries to send in their inventories, according to a press release announcing the report. Biden’s 2030 goal is part of the U.S.’ commitment to reducing its greenhouse gases made under the 2015 Paris Agreement.
Signed by 194 countries and the EU, the agreement commits the countries to limiting global temperature increases to 2 degrees Celsius over preindustrial levels at a minimum, with a preferred target of 1.5 C.
The report was produced “in collaboration with numerous experts from other federal agencies, state government authorities, research and academic institutions, and industry associations,” according to Joseph Goffman, assistant administrator for the Office of Air and Radiation.
Breakdown by Sector
The report’s analysis of emissions by economic sector provides some insights into the drivers for emission increases and decreases.
Emissions from the transportation sector, the top source of U.S. GHGs at 28%, fell 0.2% from 2021 to 2022. Light-duty vehicles — passenger cars, SUVs and light pickup trucks — accounted for 37% of transportation emissions, and medium- and heavy-duty vehicles contributed 23%, with the remainder coming from off-road sources, which can include heavy-duty construction vehicles.
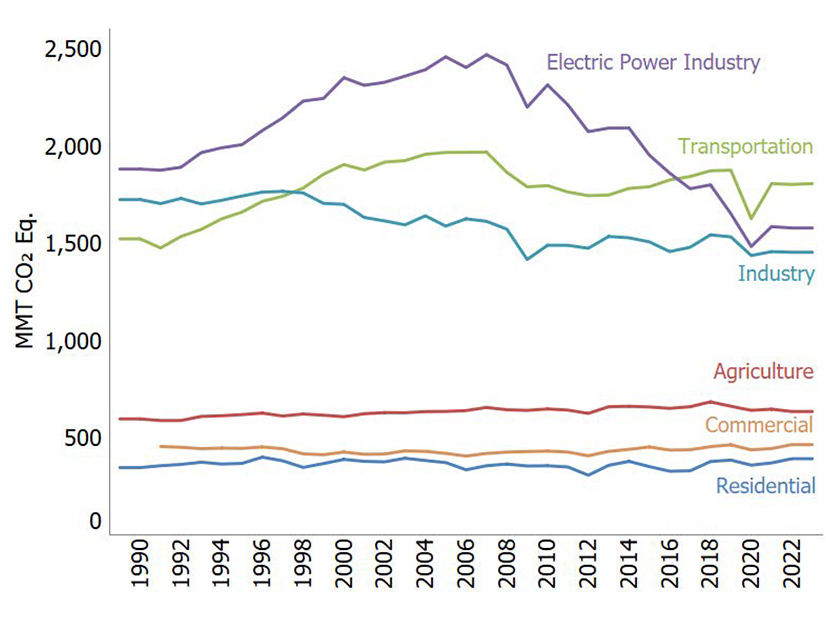
The electric power sector, now the country’s second-largest source of GHGs at 25%, also saw a small drop, 0.4%, even as electricity generation grew by 3%, as coal-fired plants retired and renewable capacity increased, the report says.
At the same time, electricity produced from natural gas and petroleum increased by 7% and 19%, respectively.
The commercial and residential sectors’ emissions increased the most from 2021, at 10.4%. The report notes that building energy use — and GHG emissions — will vary seasonally, but part of the increase in 2022 can be traced to an increase in heating and cooling “degree days,” or days when colder or hotter weather may trigger increased demand for heating or cooling, respectively.
Heating degree days increased by 7.9% from 2021 to 2022, while cooling degree days rose by 4.3%. According to the Energy Information Administration, the Mountain West states had the most heating degree days in 2022, while the West South Central states — Texas, Oklahoma, Arkansas and Louisiana — had the highest number of cooling degree days.
Industrial emissions — 23% of total U.S. GHGs — also dropped 0.2%, while electricity use increased 3% over 2021 levels. Accounting for 10% of emissions, the agricultural sector scored a 1.8% drop in GHGs, the report says.
The inventory’s preliminary figures for 2023 show decreases, with U.S. energy use falling 1% and GHG emissions dropping 3%, a step in the right direction but still not fast or steep enough to reach the nation’s 2030 targets.