By Rich Heidorn Jr.
WASHINGTON — Record high natural gas demand and production highlighted FERC’s 2018 State of the Markets report, released last week.
The report by the Division of Energy Market Oversight said gas demand was driven by electric generation and growing LNG exports. Despite big jumps in the Marcellus Shale and the Permian Basin regions, demand growth outpaced production increases.
As a result, storage levels were lower than average and “at times were the lowest in more than a decade,” FERC said, contributing to higher gas and power prices.
The Henry Hub benchmark averaged $3.12/MMBtu for the year, up 5% from 2017. Reduced storage inventories pushed Henry Hub prices up 31% in the fourth quarter over a year earlier.

| FERC
Although gas prices remained relatively low, there was increased price volatility because of storage constraints, extended winter cold and infrastructure constraints in the West. In January 2018, an East Coast cold snap pushed gas prices to $140.85/MMBtu in New York and $128.39/MMBtu in the Mid-Atlantic, with prices peaking at $78.88/MMBtu in Boston. In contrast, New York’s spot price never reached $21/MMBtu in 2017.
Gas production averaged 80.7 Bcfd, an increase of 12% from 2017. The Marcellus Shale was the most productive basin, averaging 19.4 Bcfd for 2018, up nearly 13.5% from 2017.
Haynesville Shale production jumped to an average of 6.5 Bcfd, a 46% increase that FERC attributed to higher gas prices and lower production costs. Rising crude oil prices were a factor in the 2.1-Bcfd increase in associated natural gas production in the Permian, a jump of 41%.
More than 689 miles of commission-jurisdictional pipelines, representing 13 Bcfd of capacity, went into service during 2018, much of it connecting Marcellus and Utica supplies to markets in the Midwest, Northeast and Southeast. There was no capacity increase in New England.

| FERC
Export Growth
New pipelines also provided links to LNG export terminals and exports to Mexico.
After becoming a net gas exporter for the first time in 60 years in 2017, U.S. net exports were almost 2 Bcfd in 2018, in part because of the opening of the Cove Point LNG facility in Maryland in March and the expansion of the Sabine Pass LNG terminal in Louisiana in October. LNG exports averaged nearly 3 Bcfd in 2018, a 50% jump from 2017.
Pipeline exports to Mexico rose almost 0.5 Bcfd to a new high of 4.6 Bcfd.

| FERC
The report predicted up to 4 Bcfd of new export capacity will be added in 2019, with LNG facilities at Cameron, Corpus Christi, Elba Island and Freeport expected to go into service and an additional expansion at Sabine Pass. (See related story, Enviro Protesters Scale FERC HQ as Agency OKs More LNG.)
Power Prices Rise
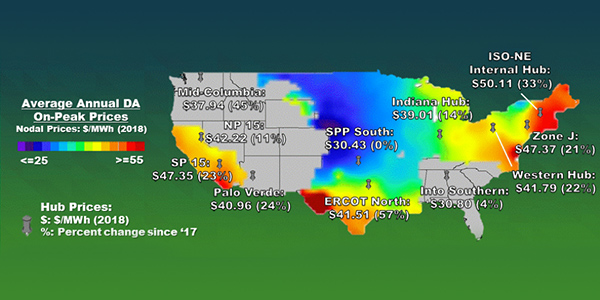
As gas continued its increasing role in electric generation, fuel price increases also caused a jump in power prices across the country.
Mean day-ahead on-peak LMPs jumped almost 25% at RTO/ISO pricing nodes. Prices in SPP, MISO and CAISO increased less than 15%, while PJM and NYISO prices rose about 20%. ISO-NE was up 33% and ERCOT had the biggest jump at 44%.
As in recent years, most new generation capacity in 2018 was natural gas, wind and solar, and most retirements were from coal.

| FERC
Capacity price trends varied in grid operators’ 2018 auctions. RTO-wide average prices declined 13% in New England’s auction for 2021/22, while the weighted average price in PJM’s auction for the same period rose 36%.
In NYISO’s spot capacity auction, prices in the high-cost Hudson Valley and New York City zones fell by 3% or more. Prices for Long Island rose 5% and the New York Control Area jumped 32%.
MISO’s Planning Resource Auction saw zonal prices rise clear much lower than in the other markets with a price of 30 cents/kW-month for most of the region for 2018/19, up 25 cents from a year earlier.