
By Steve Huntoon
It’s said the Supreme Court won’t grant review to reverse a lower court decision that is “merely wrong.” Don’t waste the court’s resources on error of little consequence.
The opposite of that we might call “scary wrong”: something profoundly wrong and with significant potential consequence.
Such is the case with the Natural Resources Defense Council’s new attack on PJM,1 accusing it of suppressing renewable resources relative to other RTOs, wasting billions of consumer dollars in the process and contending, in effect, that a cheap and reliable zero-carbon future could be ours if entities like PJM would just mend their evil ways.
NRDC is wrong in virtually every claim. And it’s scary because policy based on NRDC’s profound errors would be profoundly misguided. We can’t afford to make a bunch of mistakes in dealing with climate change.
Lies, Damned Lies and Statistics2
The gravamen of NRDC’s attack on PJM is data it compiled showing that the RTO has added more natural gas (“polluting”) resources than renewable resources since 2012. Per NRDC, other RTOs have done the reverse, adding more renewable resources than natural gas resources. NRDC points to RTOs like SPP and ERCOT as good guys.
The worst error in NRDC’s attack is its complete disregard of the relative renewable resources in PJM versus SPP and ERCOT.3
Does this make a difference? Yes, bigly.
National Renewable Energy Laboratory and Energy Information Administration data confirm what is common knowledge in our industry that RTOs like SPP and ERCOT have vastly greater wind and solar potential resources. Of note, higher percentages of its wind and solar potential resources have been added in PJM than in either SPP or ERCOT. In other words, given the renewable cards it was dealt, PJM (or more accurately the PJM region) is doing a better job.
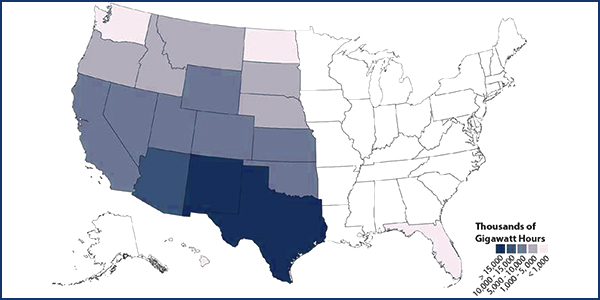
To show this, we’ll use NREL data by state on the “technical potential” of renewable resources, which reflects among other things environmental and land-use constraints. (This is important because a wind project isn’t going to be built in Philadelphia.) Let’s start with wind (because existing wind gigawatts are several times larger than existing solar gigawatts in the U.S. overall, and many times larger in the states comprising PJM, SPP and ERCOT)

NREL data show that PJM has around 165 GW of potential onshore wind capacity, in contrast to SPP’s 4,235 GW and ERCOT’s 1,426 GW.4 This means SPP has 26 times more potential wind than PJM; ERCOT has nine times more potential wind than PJM.
How much wind has been added so far in these RTOs? PJM has 9,428 MW of installed wind capacity,5 SPP has 20,610 MW,6 and ERCOT has 22,051 MW.7
So which RTO has made the most of its potential wind resources? PJM has installed 5.7% of its potential, SPP has installed 0.5% of its potential, and ERCOT has installed 1.5%.8
Thus, given the wind resource cards it was dealt, PJM has done much better than SPP or ERCOT.
How about solar?
The NREL data show that PJM has 7,611 GW of potential utility-scale solar capacity, in contrast to SPP’s 31,543 GW and ERCOT’s 15,308 GW.9 This means SPP has four times more potential solar than PJM; ERCOT has two times more potential solar than PJM.

How much solar has been added so far in these RTOs? PJM has 1,800 MW of installed solar capacity, SPP has 180 MW, and ERCOT has 1,858 MW.10
So which RTO has made the most of its potential solar resources? PJM has installed 0.02% of its potential, SPP has installed 0.0006% of its potential, and ERCOT has installed 0.01%.
As with wind resources, given the solar resource cards it was dealt, PJM has done much better than SPP or ERCOT.
Thus the reality: PJM has outperformed its RTO brethren in adding renewable resources given the cards it was dealt.
Stayin’ Alive?
Following on its unsound narrative that PJM has done poorly in adding renewable resources, NRDC looks for a culprit. And it finds one in PJM’s capacity market, which it says is “a tool for uneconomic fossil fuel power plants to get paid enough to stay alive.”
This is absurd. Since the start of PJM’s capacity market, an enormous 25,857 MW of coal generation in PJM has retired, which is more than one-third of all coal generation retirements in the entire U.S. of 70,522 MW over the same period.11
If PJM’s capacity market is a tool to keep uneconomic coal plants alive, then it is failing miserably.
NRDC also fails to explain why (per its data) ISO-NE and NYISO have added more renewable than gas megawatts when both of those RTOs have a capacity market. How can this be, given NRDC’s capacity market thesis?
The reality is that new natural gas and renewables in PJM (and elsewhere) are forcing uneconomic coal plants to retire, causing a significant reduction in carbon emissions per megawatt-hour in the RTO.12
This is what needs to continue.
And Those Extra Billions Paid by Consumers?
NRDC claims that PJM has acquired more resources in its auctions than its “target reserve,” and the “extra totals up to billions of dollars more on customer bills.”
This claim reflects a profound misunderstanding of PJM’s capacity market. When the PJM annual auction “clears” (commits to purchase) resources above its target reserve, the clearing price for all capacity resources goes down. This greatly reduces the total cost of capacity that consumers pay.
In the last auction, for example, if resources had offered prices such that the cleared resources were equal to the target reserve, consumers would have paid $18.7 billion for capacity.13 Instead, because resources offered more attractive prices, more resources cleared but at a much lower price, resulting in consumers paying $8.4 billion for capacity — roughly $10 billion less.14
NRDC has it exactly backward.
Annual Capacity Construct
NRDC says PJM has a year-round capacity requirement that hurts renewable resources for no reason. This is an amalgamation of three errors.
First, PJM in fact permits renewable resources to participate in the capacity market notwithstanding their obvious inability to be dispatchable year-round (or at all).15 NRDC ignores this.
Second, PJM in fact permits seasonal resources to match up to simulate an annual resource.16 NRDC ignores this.
Third, PJM basing the capacity construct on summer peak demand does not mean that PJM overbuys capacity for winter and other periods when peak demand is less. Resources need to be acquired for the overall peak, which happens to occur in the summer. Seasonal capacity variations have been considered and rejected for more than 10 years, with a PJM discussion here.17
If the annual capacity market was reconstructed into seasonal markets, then potentially lower prices in non-summer periods would have to be covered by higher summer prices in order to ensure resource adequacy.
There is no such thing as a free lunch.
Biting the Feeding Hand
It is ironic that NRDC targets PJM’s capacity market. The capacity market has been a bulwark against bailout claims for dirty and uneconomic power plants by enabling a transition to cleaner natural gas and clean renewable generation, while assuring resource adequacy years into the future.
Fantasy and Reality
NRDC is promoting a narrative that a cheap and reliable zero-carbon future is easily ours. This narrative requires bad guys like PJM who must be obstructing an easy path forward.
Reality is different. PJM hasn’t obstructed renewable resources and, in fact, is outperforming its RTO brethren given the renewable cards the region was dealt. PJM’s capacity market (like other RTO capacity markets) doesn’t save uneconomic coal plants, doesn’t impose excessive costs on consumers, doesn’t suppress renewable resources and is a bulwark against bailout claims for uneconomic coal units that should retire.
Dealing with climate change will not be cheap or easy.18 We should get real instead of looking for fall guys.
2- First memorialized in a press account of remarks of Arthur James Balfour, 1st Earl of Balfour, in 1892, https://www.phrases.org.uk/meanings/lies-damned-lies-and-statistics.html. Another favorite: “If you torture the data long enough, it will confess to anything,” a paraphrase from Ronald Coase, https://en.wikiquote.org/wiki/Ronald_Coase.
3- NRDC mentions resource potential as one of many factors in resource development, but then proceeds to ignore it (and all other factors) in blaming PJM’s capacity market, as discussed later.
4- The NREL data are on Table 6 of its report “U.S. Renewable Energy Technical Potentials: A GIS-Based Analysis,” available here, https://www.nrel.gov/docs/fy12osti/51946.pdf. For states partially within an RTO, I pro-rated the potential resource by the land-area portion of the state within the RTO.
5- https://www.pjm.com/planning/services-requests/interconnection-queues.aspx (select “In Service” status and wind as fuel).
6- https://www.spp.org/about-us/fast-facts/ (89,999 MW total nameplate times 22.9% wind share).
7-http://www.ercot.com/content/wcm/lists/167030/Capacity_Changes_by_Fuel_Type_Charts_May_2019.xlsx.
8- The math is dividing the installed wind capacity for each RTO by the potential wind capacity for that RTO.
9- Same NREL study, using Table 3 for “Rural Utility-Scale Photovoltaics by State.” As with wind, for states partially within an RTO, I pro-rated the potential resource by the land-area portion of the state within the RTO.
10- Same RTO sources as for installed wind capacity.
11- https://www.eia.gov/electricity/data/eia860m/xls/april_generator2019.xlsx (in Retired spreadsheet, delete pre-2008 retirements, sort by Technology and then by Balancing Authority Code, add up Net Summer Capacity for PJM and for U.S.).
12- Since 2012, when PJM began reporting CO2 lbs/MWh, they have fallen from an average of 1,092 in that year, https://www.pjm.com/-/media/library/reports-notices/special-reports/20170317-2016-emissions-report.ashx?la=en, to an average of 888 in 2018, https://www.pjm.com/-/media/library/reports-notices/special-reports/2018/2018-emissions-report.ashx?la=en. This is a reduction of 19% in six years.
13- https://www.pjm.com/-/media/markets-ops/rpm/rpm-auction-info/2021-2022/2021-2022-bra-planning-period-parameters.ashx?la=en (at the net cost of new entry of $321.57/MW-day and corresponding target reserve margin of 159,000 MW, capacity cost would have been 159,000 MW cleared at $321.57/MW-day times 365 days (individual locational deliverability areas are ignored for simplicity)).
14- https://www.pjm.com/-/media/markets-ops/rpm/rpm-auction-info/2021-2022/2021-2022-base-residual-auction-report.ashx?la=en (capacity cost was 163,627 MW cleared at $140/MW-day times 365 days (individual LDAs are ignored for simplicity)).
15- Per PJM report on the auction: “1,416.7 MW of wind resources cleared the 2021/2022 BRA as compared to 887.7 MW of wind resources that cleared the 2020/2021 BRA. … The nameplate capability of wind resources that cleared in the 2021/2022 BRA as annual CP capacity and/or winter seasonal CP capacity is approximately 8,126 MW, which is 1,407 MW greater than the 6,719 MW of wind energy nameplate capability that cleared in last year’s auction. 569.9 MW of solar resources cleared the 2021/2022 BRA as compared to 125.3 MW of solar resources that cleared the 2020/2021 BRA. … The nameplate capability of solar resources that cleared in the 2021/2022 BRA as annual CP capacity and/or summer seasonal CP capacity is approximately 1,641 MW, which is 964 MW greater than the 677 MW of solar energy nameplate capability that cleared in last year’s auction.” https://pjm.com/-/media/markets-ops/rpm/rpm-auction-info/2021-2022/2021-2022-base-residual-auction-report.ashx?la=en.
16- Per PJM report on the auction: “715.5 MW of seasonal capacity resources cleared in an aggregated manner to form a year-round commitment. This is an increase of 317.5 MW over the 398 MW of seasonal capacity resources that cleared in an aggregated manner in the 2020/2021 BRA.” Same source as preceding footnote.
17- https://pjm.com/-/media/committees-groups/task-forces/scrstf/20160923/20160923-informational-item-pjm-response-proposal-c.ashx. Prior history is recounted here, https://pjm.com/-/media/committees-groups/task-forces/scrstf/20160525/20160525-informational-past-seasonal-initiatives.ashx.
18- See for example this study involving the electric industry by Lawrence Makovich, https://www.hks.harvard.edu/sites/default/files/centers/mrcbg/files/78_tilting%40windmills.pdf, and this study involving the much broader Green New Deal by Benjamin Zycher, http://www.aei.org/wp-content/uploads/2019/04/RPT-The-Green-New-Deal-5.5×8.5-FINAL.pdf.


