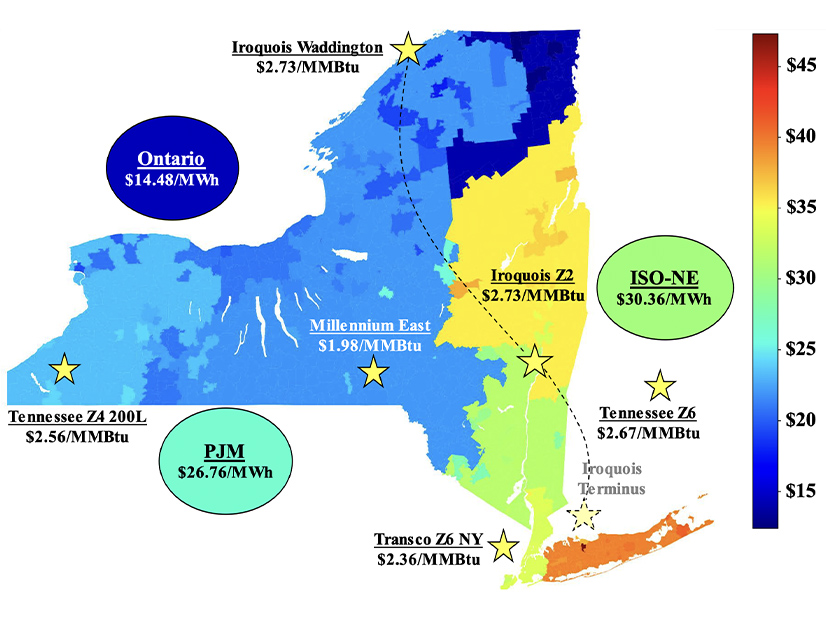
The NYISO Market Monitoring Unit reported energy markets performed competitively in the second quarter of 2021, with all-in prices ranging from $21 to $67/MWh, up 28 to 88% from the same period last year in all regions but New York City, which saw a decrease of 6.3%.
Energy prices climbed 26 to 110%, driven mainly by higher gas prices, which rose 55 to 62% across the system, Pallas LeeVanSchaick of MMU Potomac Economics, told the Installed Capacity/Market Issues Working Group on Thursday in presenting the State of the Market report for the second quarter.
“But we also saw that higher load levels were a significant driver relative to the second quarter last year, which was greatly affected by the pandemic,” LeeVanSchaick said.
Higher temperatures in June combined with nuclear and hydro output falling more than a gigawatt, driven by the Indian Point nuclear plant retirement and drier conditions, he said. “We saw also some significant transmission outages in Central East, which reduced transfers to Eastern New York and resulted in an additional need for gas-fired generation.”
Avoidable Commitments
Reliability commitments fell in New York City because of procedural improvements that reduced the commitment for N-1-1-0 load packet requirements.
But, LeeVanSchaick noted, “we see commitments that are happening that certainly could be avoided if the NYISO was allowed to consider whether [gas turbines] in a particular NOx bubble were actually needed to satisfy N-1-1-0 criteria.”
The state’s NOx rule prevents New York City gas turbines in two portfolios from generating during the ozone season unless steam turbines in the same portfolios are also producing such that the portfolio-average NOx emission satisfies the state Department of Environmental Conservation standard.
“An issue that we see in areas like New York City is that as you get more low-cost intermittent generation coming in, some of these older fossil units become less economic,” LeeVanSchaick said. “To a large extent they’ll still be running because of the need to provide operating reserves, so it’s useful to track as the resource mix changes. We want to be able to track things like emissions that are driven more by the need to provide reserves than by these energy requirements.”
One stakeholder asked what is preventing the ISO from modifying their software for commitments that could have been avoided, such as steam units that did not need to be activated to achieve peaking capacity. Steam turbines accounted for more than 50% of NOx emissions in New York City in the second quarter.
The share of NOx emissions from units flagged as committed for reliability was generally under 15% throughout April, then jumped up on May 1 to between 25 and 45%, remaining at a high percentage throughout May before coming down somewhat as loads increase in June, LeeVanSchaick said. “But it still remains higher [in June] than it was in April because you’re getting more generation commitments to meet NOx bubble requirements,” which are effective from May to September.
The Monitor reported seeing less out-of-market commitments in New York City for local requirements in the quarter, and also “a lot less” out-of-market dispatch in Long Island because NYISO began modeling two 69-kV constraints there in the market software in mid-April.
The two constraints accounted for 40% of the day-ahead congestion and 25% of real-time congestion on Long Island; consequently, out-of-market actions to manage 69-kV constraints fell notably, resulting in more efficient resource scheduling and pricing and lower associated uplift.
Capacity Market Highlights
Capacity prices fell in New York City because of the much lower locational capacity requirement (LCR), while they rose in other areas because of the higher installed reserve margin (IRM) and the Indian Point retirement.
Spot capacity prices averaged $6.59/kW-month in Long Island, $3.85/kW-month in the Zone G-J locality and Rest-of-State, and $6.37/kW-month in the city in the second quarter.
Prices increased substantially in all regions from the prior year, except in New York City where prices fell by 54%, driven primarily by a 6.3% reduction in the LCR from the prior capability year.
The steep reduction in the LCR year over year despite no significant changes in the supply mix in the city highlights some procedural inefficiencies in the IRM and LCR-setting process discussed in the Monitor’s 2020 report, LeeVanSchaick said.
Higher spot market offers and resultant unsold capacity influenced the spot price in April. Several units exited the market, most notably Indian Point 3 in May, which outweighed new entry and increased imports, he said.


