November 18, 2024

Counterflow: Long-duration Energy Storage: Reality Check

Steve Huntoon |

Here’s the bottom line on carbon-free electricity: The proponents envision a massive portfolio of wind and solar generation. And somehow, the intermittent nature of these renewable resources will be covered by some type of storage. 

In other words, wind and solar output in excess of demand from hour to hour will charge the storage, and the storage will discharge into the grid when wind and solar output cannot meet demand. 

In theory, this can work. But as it is said, “In theory, theory and practice are the same. In practice, they are not.”1  

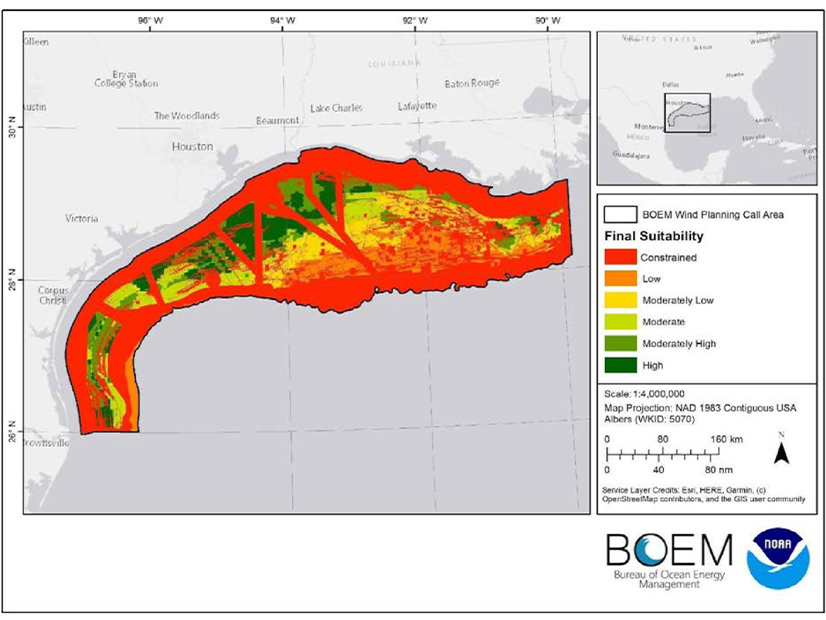
As I’ve discussed before, renewable resources may collectively produce little electricity for days or weeks on end.2 In 2018, there was a three-week period in PJM in which wind and solar resources averaged 10% of their combined nameplate capacity.3  

For more than three weeks in the summer of 2018, PJM’s solar and wind generation averaged only 10% of their combined nameplate capacity of 9,694 MW. | PJM

Thus, short-duration storage — one to eight hours — is basically worthless to cover a demand/supply drought that lasts for days. Short-duration storage is discharged in Day 1; there’s no net supply to recharge the storage; and that’s that. Game over. 

Enter Long-Duration Energy Storage

So that brings us to long-duration energy storage (LDES). This is now portrayed as the solution to extended droughts of wind and solar generation.  

There are many potential types of LDES.4 The most commonly cited type of LDES is iron-air (a.k.a. iron-rust or metal-air) battery storage, as typified by Form Energy, which has raised almost $1 billion for this technology.5 (My take on green hydrogen for storage or anything else is here.6 ) 

But hard data suggest iron-air technology is not ready for prime time. Practice may trump theory again. 

Poster Child: Form Energy California Project

Data points come from a California Energy Commission announcement of a $30 million grant to Form Energy for a 5-MW/500-MWh battery storage project in Mendocino County.7 This is what’s called a 100-hour storage project: 500 MWh divided by 5 MW is 100 hours. And $30 million divided by 500 MWh is $60,000/MWh.

Scoping the Challenge

As noted above, because wind/solar generation can be small for days at a time, maintaining reliability would require some way to cover net load8 for such a period. But how many days? 

A study of such renewable droughts in the U.S. came out last year.9 The study analyzed hourly data on wind output, solar output and demand by region (balancing authority). The study is complex, but the gist is to confirm the need to somehow cover multiday renewable droughts across a given region, with California the most vulnerable, with six-day droughts to be expected. The study also found that load levels are positively correlated with droughts, so low load cannot be relied on to help cover renewable droughts. 

What’s It Gonna Take?

We’ll assume needing battery storage to cover six days of severe renewable drought in California. With an average hourly load in California of 28.8 GWh,10 an average 80% supply/demand deficiency11 would be 23 GWh, which, multiplied by 24 hours and by six days, is 3,314 GWh.

What’s It Gonna Cost?

Batteries to store those 3,314 GWh at a capital cost of $60,000/MWh, based on the Form Energy project, would cost $198.8 billion, which at an annual carrying charge rate of 12%12 is $23.9 billion per year.  

This is without any cost for the energy to charge the batteries, but let’s optimistically assume the batteries can be charged with wind and solar otherwise curtailed so the energy cost would be negligible. Is there some substantial offsetting economic value of the batteries, such as energy arbitrage between high- and low-cost hours? Well, the round-trip efficiency is 35%13, which suggests limited energy arbitrage opportunity. 

What is the rate impact of this? If we divide that $23.9 billion per year by California’s annual electric usage of about 252,000 GWh per year,14 the rate impact is 9.5 cents/kwh. This would about double the generation component of California’s average electric rate and increase the already-high average retail rate by about 50%.15 Yikes! 

And this is just for the battery storage. The cost of the renewable generation itself is not included. 

Alternatives

There are other alternatives for covering California’s renewable droughts, but I’m going to focus on the existing natural gas fleet. Let’s assume we can keep 23 GW around to cover the average net load of 23 GW during a renewable drought.16 According to the California Energy Commission, the cost of retaining gas plants is between $34.26 and $43.05/kW/year.17 I’ll use the higher figure. So, the annual cost would be $990 million.  

We’ll need 3,314 GWh (calculated above) of generation to cover six days. We’ll use the National Energy Technology Laboratory’s (NETL) gas supply and other variable cost of $36.4/MWh.18 For one six-day drought, the total fuel/variable cost is $121 million. 

So, the cost to retain natural gas plants and to cover their variable costs for a six-day drought is $1.1 billion.  

Comparing Battery Storage and Retained Gas Plant Costs

Comparing the annual cost of battery storage of $23.9 billion to the annual cost of retaining gas plants of $1.1 billion means it would cost 20 times as much to employ battery storage to cover renewable droughts as to retain gas plants for that purpose. Yikes! 

And What About Greening Those Gas Plants?

This is where things get really interesting. 

What’s the additional cost to get to no (or very low) carbon using the retained natural gas plants? There are at least three options: (1) purchasing carbon offset credits for the carbon emissions from the gas plants; (2) purchasing carbon offset credits that are solely carbon capture and storage (CCS); and (3) retrofitting the gas plants with CCS facilities.  

Regarding the first option, Bloomberg forecasts carbon offset credits to cost $13/ton in 2030 and $20/ton for “high-quality” offset credits under tighter rules.19 Let’s use the higher price and convert the $20/ton to $9/MWh using an Energy Information Administration conversion rate of 0.97 pounds/kWh.20 For 3,314 GWh per year, the cost is about $30 million per year. 

The second option involves carbon offset credits that are solely CCS. Bloomberg forecasts a 2030 price for such credits of $146/ton.21 Climeworks, a developer of direct air capture plants, is forecasting a $300 to $350/ton cost in 2030 for new plants.22 Using the highest of these costs and the preceding EIA conversion rate for 3,314 GWh per year entails a cost of about $525 million per year. 

The third option is retrofitting gas plants with CCS facilities at a capital cost, according to an NETL study, of $1,212/MW23, which for 23 GW is $27.9 billion, which at an annual carrying cost rate of 12% is $3.3 billion per year.  

The Bottom Line

Now let’s compare the annual costs of long-duration battery storage with the costs of no-/low-carbon gas plant retention alternatives: 

Long-duration battery storage:  $23.9 billion 

Gas plants with carbon credits:   $1.1 billion 

Gas plants with CCS credits:        $1.6 billion 

Gas plants with CCS retrofit:       $4.4 billion 

See the difference? 

What About Future Cost Reductions in LDES?

This comparison of options is based on the cost of the Form Energy California project. There are claims of future large reductions in iron-air battery costs — let’s assume the cost per megawatt-hour goes down by two-thirds in line with Form Energy’s claimed future reduction in the kilowatt-per-year cost relative to its California project24 and a similar two-thirds reduction hypothesized in an MIT study.25 The economics remain dreadful relative to keeping gas plants around. And, of course, carbon offset and CCS retrofit costs may decline as well. 

Near-term Implications

“It is difficult to make predictions, especially about the future.”26 But it’s this sheer uncertainty that militates for keeping natural gas plants around in some form. For example, instead of decommissioning gas plants perhaps mothball them at relatively low cost. This would preserve the option of using carbon credit offsets and/or CCS retrofit in the future. 

Big Picture Implications

LDES is extremely expensive. It does not make economic sense relative to retaining natural gas plants with various carbon-abatement alternatives. 

Policymakers — legislative and regulatory — should insist on apples-to-apples comparisons of alternatives for abating carbon while maintaining reliability.

Columnist Steve Huntoon, principal of Energy Counsel LLP and a former president of the Energy Bar Association, has been practicing energy law for more than 30 years. 


1 https://quoteinvestigator.com/2018/04/14/theory/
2 https://energy-counsel.com/wp-content/uploads/2022/11/More-Happy-Talk.pdf; https://www.energycounsel.com/docs/cue-more-pixie-dust.pdf; https://www.energy-counsel.com/docs/Cue-the-Pixie-Dust.pdf; https://www.energy-counsel.com/docs/German-La-La-Land.pdf; https://www.energy-counsel.com/docs/No-CarbCalifornia.pdf; https://energy-counsel.com/docs/Grid-Batteries-Kool-Aid-Once-More-with-Feeling-RTO-Insider-12-5-17.pdf; https://www.energy-counsel.com/docs/Battery-Storage-Drinking-the-Electric-Kool-Aid-FortnightlyJanuary-2016.pdf.
3 https://www.energy-counsel.com/docs/Cue-the-Pixie-Dust.pdf
4 https://energy.mit.edu/wp-content/uploads/2022/05/The-Future-of-Energy-Storage.pdf, pages xiii-xvii.
5 https://www.scientificamerican.com/article/rusty-batteries-could-greatly-improve-grid-energy-storage/
6 https://energy-counsel.com/wp-content/uploads/2023/12/Hydrogen-Reality.pdf
7 https://www.energy.ca.gov/news/2023-12/cec-awards-30-million-100-hour-long-duration-energy-storageproject; https://www.energy.ca.gov/sites/default/files/2023-10/CEC-500-2023-055-D.pdf. The economics of this project don’t reconcile with the description of a Form Energy project in New York said to be twice the size at less than half the cost, https://www.nyserda.ny.gov/About/Newsroom/2023-Announcements/2023-08-17-GovernorHochul-Announces-Nearly-15-Million-in-Long-Duration-Energy-Storage, although one difference is that New York limits its contribution to half the project cost, https://portal.nyserda.ny.gov/servlet/servlet.FileDownload?file=00P8z000001ocKUEAY.

8 Net load is gross load net of wind/solar generation.
9 https://www.sciencedirect.com/science/article/pii/S0960148123014659?via%3Dihub The press release summarizing the results is here, https://www.pnnl.gov/news-media/energy-droughts-wind-and-solar-can-lastnearly-week-research-shows
10 https://efiling.energy.ca.gov/GetDocument.aspx?tn=254463, page 13.
11 This means that average hourly renewable generation is covering 20% of average hourly gross load. The remaining 80% (net load) must be met by storage. This definition of severe renewable drought comes from this study, https://www.sciencedirect.com/science/article/abs/pii/S0960148118302829?via%3Dihub, page 581 and Figure 2.
12 An annual carrying charge rate reflects return of and on capital. It is currently 11.8% in PJM. https://www.pjm.com/-/media/committees-groups/committees/teac/2023/20230711/20230711-informational—market-efficiency-analysis-assumptions—july-2023.ashx
13 https://www.energy.ca.gov/sites/default/files/2023-10/CEC-500-2023-055-D.pdf, page 44.
14 https://efiling.energy.ca.gov/GetDocument.aspx?tn=254463, page 13.
15 https://www.eia.gov/outlooks/aeo/supplement/excel/suptab_54.22.xlsx, focusing on the generation sector average component around $0.10/kWh, and average total end-use prices around $0.20/kWh. Other EIA data suggest a higher current end-use price around $0.25/kWh, https://www.eia.gov/electricity/monthly/epm_table_grapher.php?t=epmt_5_6_a.

16 https://www.energy.ca.gov/data-reports/energy-almanac/california-electricity-data/electric-generationcapacity-and-energy
17 https://www.energy.ca.gov/sites/default/files/2024-01/CEC-500-2024-003.pdf, page 10.
18 https://www.osti.gov/servlets/purl/1961845, Exhibit 4-6, page 26.
19 https://about.bnef.com/blog/global-carbon-market-outlook-2024/
20 https://www.eia.gov/tools/faqs/faq.php?id=74&t=11 $20/metric ton divided by 2,205 pounds/ton is $.009/pound, which is $.009/kwh or $9/MWh.
21 https://about.bnef.com/blog/global-carbon-market-outlook-2024/
22 https://www.cnn.com/2024/05/10/world/video/largest-carbon-capture-factory-opens-vause-wurzbacher-intvcnni-climate-or-business-fast
23 https://www.osti.gov/servlets/purl/1961845, Exhibit 4-5 on page 25, averaging the all-in TASC $/kw for the two 95% capture projects. Transportation and storage of the carbon is projected by DOE/NETL to cost $3.7/MWh, Table 4-6, page 26, which for 5,328,000 MWhs per year is a small cost of about $20 million per year. Another DOE retrofit study is here, https://www.energy.gov/sites/default/files/2024-04/OCED_Portfolio_Insights_CC_part_i_FINAL.pdf

24 https://www.edockets.state.mn.us/edockets/searchDocuments.do?method=showPoup&documentId={00AE3887-0000-C24C-BFC6-45EC1209A3DB}&documentTitle=20233-194396-08, Table 1, making reduction from the California project $6,000,000/MW to $1,900,000/MW (converting kW to MW).
25 https://energy.mit.edu/wp-content/uploads/2022/05/The-Future-of-Energy-Storage.pdf, page 37.
26 Dutch saying, c. 1937, https://quoteinvestigator.com/2013/10/20/no-predict/.

Hurricane Threat to OSW Turbines Quantified

Two new reports examine storms and other obstacles facing offshore wind development in the Gulf of Mexico. 

The challenges of siting wind energy generation in the Gulf were highlighted in 2023, when the U.S. Bureau of Ocean Energy Management’s first Gulf offshore wind energy lease drew minimal interest from potential developers. (See Gulf of Mexico Wind Energy Auction Falls Flat.) 

However, the Biden administration remains keenly interested in wind energy development in the Gulf, and BOEM this year proposed a second auction, with changes intended to boost bidder interest. (See BOEM Proposes Second OSW Auction in Gulf of Mexico.) 

BOEM on May 16 announced release of “Gulf of Mexico Offshore Wind Energy Hurricane Risk Assessment” and “Assessment of Offshore Wind Energy Opportunities and Challenges in the Gulf of Mexico.”  

The two new studies are intended to inform local, state and federal strategic renewable energy planning. They are a collaboration by the National Renewable Energy Laboratory, the National Oceanic and Atmospheric Administration’s National Centers for Coastal Ocean Science, Applied Research Associates and CSS.  

One of the challenges to siting wind turbines in the Gulf of Mexico is the wind itself, which typically is weaker than in the wind energy development zones off the Atlantic and Pacific coasts — except during the Gulf region’s infamous storms, when the wind can increase to damaging velocity. 

NOAA’s historic hurricane mapping system shows 62 hurricanes hitting the Louisiana and Texas coastline in the past century, 18 of them since 2000. There also were 72 tropical storms and 37 tropical depressions in the past 100 years. 

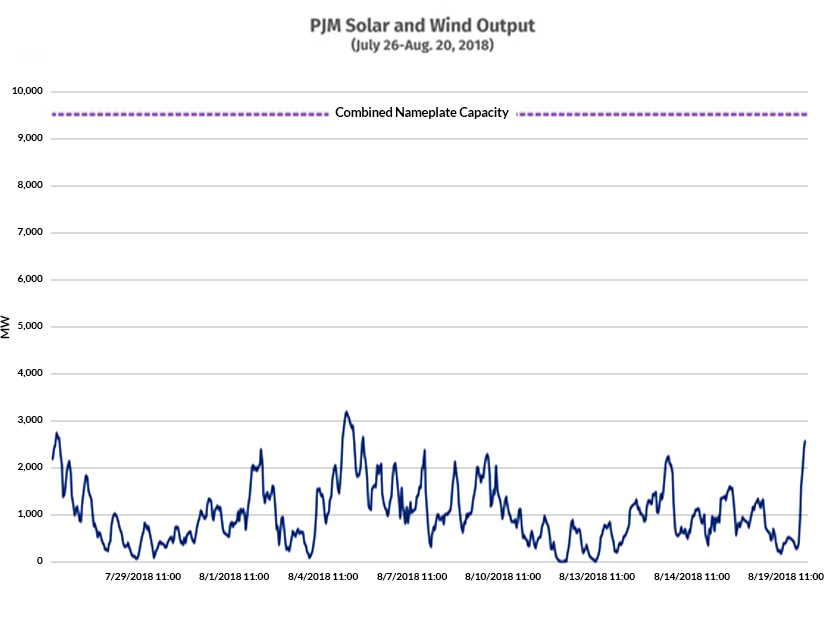
The 30-million-acre Call Area designated by BOEM follows the coast from the Mississippi River Delta to the Mexican border. The areas designated for lease so far have been clustered south of the east Texas coast. 

“To ensure the robust design of wind turbines in the Gulf of Mexico, it is critical to understand the added risk posed by the threat of major hurricanes,” the hurricane report’s authors write in their executive summary, “because those affecting the Gulf of Mexico region have a significant potential to exceed design limits prescribed by the International Electrotechnical Commission (IEC) wind design standards.” 

A problem that immediately presented itself is the mismatch between the data used for the Saffir-Simpson hurricane scale and the IEC design criteria (in which measurements are taken for a much shorter duration at a much greater height above sea level than for Saffir-Simpson).  

Also, there are very few detailed measurements of turbulence within hurricanes over the ocean. 

IEC standards call for turbines to have a minimum 20-year lifespan and for the return period — the estimated average time between extreme wind events where they are erected — to be at least 50 years. 

The authors concluded the 70-meter-per-second 3-second gust specified as the limit for IEC Class 1A turbines would be associated with a strong Category 2 hurricane and have a return period of 20 to 45 years in the Gulf. 

The 80-meter-per-second 3-second gust specified for IEC Typhoon Class turbines would be associated with a moderate Category 3 hurricane and have a return period of 40 to 110 years. 

“This indicates that the Class 1A limit state may be nonconservative for the entire Gulf of Mexico Offshore Wind Energy area, while the Typhoon Class limit state may be adequate for the design of turbines in some regions,” the report says. 

NOAA shows 34 hurricanes rated at Category 2 or worse in the past century along the Texas-Louisiana coastline. 

A map shows suitability ratings for offshore wind energy development off the coasts of Texas and Louisiana. | BOEM

The second report raises another problematic aspect of hurricane winds: their potential to cause construction and operational risks severe enough to give insurers pause. Without insurance, a project is not financeable. 

The report says best practices for risk reduction and risk transfer are not established because there is so little operational experience with offshore wind in extreme conditions. 

However, some data are beginning to emerge from typhoons in the Taiwanese Strait, and manufacturers are developing hurricane-specific turbine designs. Successful offshore oil and gas substructure designs are informing offshore wind designs. 

The Gulf has the opposite problem on the other 364 days of the year, when there is no hurricane: The wind speed is lower than in the Atlantic or Pacific, reducing the gross capacity factor and annual energy output of a turbine while boosting its downstream wind wake effects. 

The report states there is no simple engineering solution for designing wind turbines for slower average wind speeds punctuated by dangerously high wind speeds. 

On a positive note, the report indicates the shortage of vessels and ports facing offshore wind development elsewhere in the country is less of an issue along the Gulf Coast. 

The authors identified nine ports that could support offshore wind and said those that would need upgrades would need less extensive upgrades than ports in other parts of the country. 

The authors also identified 25 potential points of interconnection with capacity of at least 230 kV but added that lengthy interconnection queues and other challenges exist in the Gulf region, as elsewhere.

New Mexico Plots Next Steps for Day-ahead Market Decisions

As a next step in deciding which of two competing Western day-ahead markets to join, two New Mexico utilities are commissioning a study of transfer capability under different market scenarios. 

Public Service Company of New Mexico (PNM) and El Paso Electric expect to have the results of the study in July, according to New Mexico Public Regulation Commissioner Gabriel Aguilera. 

Aguilera mentioned the study during a PRC workshop May 17 on utilities’ regional market participation. The commissioner has coordinated what so far has been three workshops on the topic. 

Aguilera said he’s planning another workshop in August in which PNM and El Paso Electric can discuss “the transfer capability that exists into either market. And especially with respect to the transmission rights that they have, and other entities could have [in] either option.” 

“The connectivity is really going to be a big factor in any decision that the utilities make,” Aguilera said. 

The PRC opened a docket last year and has held workshops with the goal of developing guiding principles for utilities’ participation in a day-ahead market or RTO.

Aguilera invited entities to submit a draft guidance document for the commission to consider.  

The May 17 workshop featured presentations from CAISO on its Extended Day-Ahead Market (EDAM) and from SPP on its Markets+ offering. CAISO and SPP representatives discussed governance, market design and implementation timelines for their respective markets — similar to ground they covered in other recent presentations. (See Nevada RTO Proceeding Examines EDAM, Markets+ Design.) 

Both markets were developed with extensive stakeholder input. 

In fact, Aguilera said, participation has been so extensive it has left some stakeholders feeling overwhelmed and getting left behind in the process. But other stakeholders “have more resources and a lot at stake,” he added. 

“When you think about a stakeholder-driven process, it sounds great,” Aguilera said. “In practice, if it’s really these entities that have the most resources driving it, then it’s not really fair.” 

In particular, consumer advocates and state regulators need a larger role, he said. 

In addition to an August workshop on transfer capability, the commission might invite presentations from the West-Wide Governance Pathways Initiative and the Western Resource Adequacy Program (WRAP). The Pathways Initiative is an effort to create the governance framework for an independent market that expressly includes the state-run CAISO. 

Commissioner James Ellison said the August workshop will address a key topic. 

“The market design is important, but you’ve got to have the capacity for the regional exchanges to happen in order for the market to be valuable,” he said. 

Ellison said New Mexico is unique in having merchant transmission lines being built primarily to send wind power to California.

He said New Mexico ratepayers could benefit from California imports, which at times dip into negative pricing because of excess solar resources. 

“I do think that consideration should be given to the ability of these merchant lines to allow for that regional market participation,” Ellison said.

CAISO Moves for Expedited Change to Soft Offer Cap

CAISO is moving quickly to win approval for a proposal to raise the soft offer cap in its market from $1,000/MWh to $2,000 to accommodate the bidding needs of battery storage and hydroelectric resources in time for operations this summer. 

The expedited proposal will be put up for a vote by the ISO’s Board of Governors and the Western Energy Imbalance Market’s Governing Body during their joint meeting May 22. 

A product of stakeholder discussions in the ISO’s Price Formation Enhancements (PFE) Working Group, the two-part proposal seeks to allow “energy-limited” resources with “intraday opportunity costs” — specifically batteries and hydro — to reflect those costs in their energy bids. 

Those opportunity costs become a factor on days when the grid is stressed by tight supplies, usually from extreme weather. Under those conditions, energy-limited resources committed to the market at the $1,000/MWh soft offer cap can find themselves dispatched at high prices occurring relatively early in the day. But because of constraints on their use once they’ve depleted their available energy, they will be unable to offer into the market later in the day in the face of even higher prices (which often signal the need for more supply to prevent grid emergencies), reducing their opportunity to earn revenues. 

“Market participants have posited that allowing these [opportunity] costs to be accurately reflected will ensure the market can effectively and efficiently manage the dispatch of these resources,” CAISO’s proposal says. 

The proposal is tied to the ISO’s rules stemming from FERC Order 831, which was issued in November 2016. That order required RTOs/ISOs to subject the bids of an energy resource in their markets to the higher of either a soft offer cap of $1,000/MWh or a cost-based offer already verified by the market operator, which can exceed the soft cap. In the CAISO market, the ISO-recognized offer level for a resource is referred to as the resource’s default energy bid (DEB). 

To address concerns about the potential for runaway prices because of market power, Order 831 also directed RTOs/ISOs to set a hard cap of $2,000/MWh for energy offers in calculating LMPs. 

‘Uncap the DEB’

CAISO’s proposal explains that, to comply with Order 831, the ISO developed a reference level change request (RLCR) process to verify that a resource’s costs exceed the soft offer cap, allowing a resource to update its DEB to reflect its full costs for serving incremental demand. 

But the RLCR process “was tailored toward gas resources that faced discrepancies between their actual fuel costs and the costs that CAISO’s market systems used to calculate their DEB” and “was designed to validate requested DEB adjustments, using a reference based on fuel costs, in response to changing fuel costs.” 

Energy storage and hydro resources cannot use the RLCR process “to adjust their DEBs in response to intraday opportunity costs because the ISO does not have rules to determine a reasonable cost expectation upon which to base an intraday opportunity cost adjustment request,” the proposal says. “Without the ability to use the automated RLCR process, hydro and storage resources cannot request DEB adjustments or bid above the soft offer cap when opportunity costs materialize in real time.” 

To remedy that issue, the first part of the proposal (section 4.1) calls for the cap on all energy bids — including those from natural gas-fired resources — to be raised from $1,000/MWh to $2,000. 

“This proposal would ‘uncap the DEB’ for all resources” in both the day-ahead and real-time markets, CAISO wrote. “In particular, this would allow hydro resources to bid up to a value that reflects the opportunity costs already defined in their DEBs, even when those costs exceed $1,000/MWh.” 

Because the DEB reflects a resource’s “verifiable” cost-based offer, the proposal would comply with Order 831 rules requiring such offers to be capped at $2,000/MWh, CAISO said. The plan represents “a process change, not a value change,” because eliminating the $1,000/MWh from the DEB calculation “does not change the basis for calculating marginal reference costs accepted” as the DEB, as outlined in the ISO’s tariff, it said. 

The ISO also attempts to provide assurance that the change won’t mean gas-fired resources will have a free pass to increase their DEBs. 

“This proposal would not change the resource-specific parameters defined by any resource’s DEB calculation, but offers value to resources for whom the automated RLCR process is cumbersome or unusable for validating costs above $1,000/MWh,” the proposal says. 

Rules for Storage

But the proposal also explains that the proposed bidding changes cannot apply to battery storage resources in the near term because the technological changes needed to accommodate them cannot be implemented by this summer. 

For that reason, CAISO proposes a second provision (section 4.2) that offers an “interim solution” by modifying market rules to provide storage resources in both the ISO and the WEIM to bid with more flexibility. 

“The additional flexibility allows these resources to reflect intraday opportunity costs not fully captured by the existing storage DEB, and allows storage resources to unlock the benefit of the uncapped DEB value as a cushion in the event of market power mitigation,” the proposal says. 

Under the plan, instead of using a storage resource’s uncapped DEB to formulate a bid, the proposal calls for using the market’s maximum import bid price (MIBP) — set by bilateral market prices outside CAISO — as a proxy for the resource’s “verifiable opportunity costs.” 

“The ISO proposes to allow storage resources to bid up to the higher of the MIBP’s fourth-highest calculated hourly value and the highest cost-verified bid when either of those values rise above $1,000/MWh,” allowing those resources to manage their state of charge (SOC) through economic bids. 

“Functionally, this proposal ensures four hours of SOC, which correlates to the typical sizing of the existing battery fleet, is available for use across net-peak hours, aligns with the day-ahead schedules and accurately values the storage resources’ opportunity costs,” the proposal says. 

MSC Endorses

CAISO’s Market Surveillance Committee endorsed the proposal in a 3-0 vote during its meeting May 15.  

Committee members said that, for them, concerns about reliability trumped those about market power. 

“I would say on balance, we’re more worried about the depletion of storage than we are about the questions of system market power at this point,” said James Bushnell, professor in the Department of Economics at the University of California, Davis. 

Kyle Navis, a senior analyst with the California Public Utilities Commission’s Public Advocates Office, expressed concern about letting batteries bid above the cap and warned the proposal was advancing too quickly. 

“I want to say that Cal Advocates agrees that the problem statement guiding this initiative is a valid concern that needs to be addressed,” Navis said. “At this particular point, our fundamental overarching concern is that the expedited interim solution for summer 2024 has been too rushed and is not ready for adoption and creates significant cost risks.” 

Michele Kito, CPUC regulatory analyst, expressed myriad concerns with the proposal, including a contention that the new bid calculation used for storage resources would represent a price based on a “thinly traded” bilateral market rather than a true opportunity cost for those resources. 

NYISO Reports Adequate Capacity for Summer, but Heat Waves a Concern

NYISO officials told stakeholders May 16 that the ISO expects enough capacity to serve peak load this summer under normal conditions, but hotter-than-expected weather could lead it to resort to emergency procedures. 

The ISO expects to have about 34.9 GW of capacity to serve an expected peak load of about 31.5 GW and maintain its operating reserve requirement of 2.62 GW under its baseline forecast. The 752-MW capacity surplus is down 45.8% from last summer, continuing a downward trend. 

NYISO saw a peak load of about 30.2 GW last summer, less than its baseline forecast of 32 GW. 

The surplus would become a deficiency under extreme weather conditions, namely a sustained heat wave in which average daily temperatures stay in the high 80s or above over a multiday period. NYISO would be forced to resort to its emergency operating procedures to unlock an additional 3,275 MW to maintain resource adequacy. Under the most extreme scenario examined, the capacity margin would be a razor-thin 182 MW. 

Aaron Markham, NYISO vice president of operations, told the Operating Committee that the main driver in the reduction of surplus from last year is a nearly 1.4-GW decrease in net imports from neighboring balancing authorities. He also noted a 900-MW increase in total available capacity from last year is mostly offset by an increase in assumed unavailable capacity from derates. 

The ISO has added a net 393 MW in generation since July 1, 2023, with 452 MW of new facilities — mostly wind and solar — going into service. But “the average forced outage rate of those intermittent resources is quite high,” Markham said. “Probably 80% of that [additional capacity] is assumed available during the peak load hour, depending on when it occurs.” 

NYISO also presented “more focused” assessments for subregions, including New York City, the surplus for which is 348 MW without taking special-case resources into consideration. 

Howard Fromer, of PSEG Power New York, asked what the ISO would do if its assessment showed a deficiency under its baseline forecast, if anything. 

“There are a number of tools in the toolbox, whether they be emergency operating procedures; running the transmission system to emergency transfer ratings,” Markham replied. “There’s a number of actions that, even if this showed negative, and we actually experienced those conditions in real time, would be implementable before we would need to shed load in New York City.” 

NYISO’s assessment followed a similar one from NERC released the day before. (See related story, NERC Summer Assessment Sees Some Risk in Extreme Heat Waves.) 

“Reliability margins have declined by more than 1,000 MW in just the last two years. That’s a significant issue, especially when we’re impacted by heat waves,” NYISO COO Emilie Nelson said in a press release. “As demand is forecasted to rise in the coming years, this trend will continue to pose a challenge to system reliability.” 

The ISO also noted in the press release that its Comprehensive Reliability Plan found that reliability margins will continue to shrink across the state through 2032. (See NYISO’s 10-Year Forecast: Challenges Ahead, but No Immediate Needs.)

Biden Doubles Down on Support for US Solar Manufacturing

President Joe Biden upped the ante in his efforts to break China’s dominance in clean energy manufacturing with a second round of announcements of tariffs, tax credits and federal funding specifically aimed at protecting and expanding the buildout of solar manufacturing in the United States.  

Two days after doubling the tariffs on Chinese solar cells and panels from 25% to 50%, Biden reconfirmed on May 16 that the two-year moratorium he had allowed on cells and panels from Cambodia, Malaysia, Thailand and Vietnam will sunset June 6. He also announced that a tariff exemption for bifacial solar panels — which can generate electricity on both sides — would be terminated “imminently.” (See Biden’s New Tariffs Target China’s Dominance in Solar, EV Markets.) 

Set under Section 201 of the Trade Act of 1974, tariffs on both the Southeast Asian panels and cells and bifacial panels will be 14.25% through February 2025 and then 14% through February 2026. Biden initially extended the tariffs for four years in 2022, but allowed the hold on duties for bifacial and Southeast Asian panels after heavy lobbying from the solar industry. (See Biden Waives Tariffs on Key Solar Imports for 2 Years.)  

The other major component of the announcement was additional guidance from the Treasury Department, making it easier for solar developers and manufacturers to meet the requirements for the Inflation Reduction Act’s bonus tax credits for domestic content. The law provides a 10% adder to its 30% investment tax credit for solar panels or other clean energy equipment with at least 40% domestic content; however, developers and manufacturers had raised concerns about the difficulties of tracking the materials and costs in their supply chains. 

The new guidelines create an “elective safe harbor that gives clean energy developers the option of relying on Department of Energy-provided default costs percentages to determine bonus eligibility,” according to a White House fact sheet. The Treasury guidelines include an “exhaustive” list of solar panel components and their default domestic content percentages, from solar cells (36.9% for ground-mounted panels with tracking) to adhesives (0.2%).  

“The initial guidance lacked clarity and made some of those projects difficult to get financed,” said Mike Carr, executive director of the Solar Energy Manufacturers for America (SEMA) Coalition, an industry trade group. It required “a back-and-forth with the manufacturer on what their direct costs and various components were, and it was basically often an impossible task. Very few manufacturers were able to comply with that,” Carr said in an interview with NetZero Insider. 

Biden has provided some wiggle room for developers and importers with pre-existing contracts and with cells and panels sitting in warehouses. Importers with pre-existing contracts for bifacial panels to be delivered within 90 days of the end of the exclusion will be grandfathered in duty-free during that period, as long as they’re able to certify their contracts. 

Similarly, panels imported duty-free from Cambodia, Malaysia, Thailand and Vietnam will have to be installed within six months of arrival in the U.S. to prevent stockpiling, the White House fact sheet says. Customs and Border Protection “will vigorously enforce this provision, including by requiring importers to provide … certification of solar module utilization with detailed information about the modules being deployed.” 

The administration also has pledged to monitor the level of imported solar cells allowed in duty-free under Section 201, officially called the tariff-rate quota. At present, the first 5% of solar cells imported into the U.S. per year are duty free, but the quota could be increased to 12.5% “if imports approach the current level, to ensure domestic module manufacturing continues to grow while manufacturers scale production throughout the supply chain,” according to the fact sheet.  

According to industry analysts Wood Mackenzie, the U.S. last year imported only 3.85 GW of cells under the tariff-rate quota. But research analyst Elissa Pierce said imports could exceed the 5% limit this year as U.S. solar panel manufacturing and deployment ramp up.  

The Department of Energy announced its own contribution to supply chain buildout on May 16, with $71 million for 18 projects in 10 states, which will “address gaps in the domestic solar manufacturing capacity … including equipment, silicon ingots and wafers and both silicon and thin-film solar cell manufacturing,” according to a DOE press release.   

Three projects aimed at establishing new domestic supply chains for silicon ingots and cells are earmarked for $18.1 million. 

Carr said that for solar manufacturers, the administration’s support for wafer and cell production is “a significant step forward,” providing market certainty to spur investment. 

“That’s been the sort of a piece of the supply chain that has faced the most difficulty in getting investment … because it’s so capital intensive, and it’s so dependent on the customer demand driver of domestic content,” he said. Whether it’s cell manufacturing or polysilicon or even module manufacturing, until we break that stranglehold that China has over that piece of the [supply] chain, we’re really going to continue to be stuck.” 

Solar Tariffs: a Brief History

The Trade Act of 1974 provided for two classes of tariffs, both intended to protect U.S. companies from the unfair trade practices of foreign countries. Under Section 301 tariffs, the focus of Biden’s May 14 announcements, the government can impose trade sanctions against countries that violate U.S. trade agreements or engage in “unjustifiable” or “unreasonable” acts that burden domestic companies.  

Section 201 authorizes the president to impose temporary duties or other nontariff barriers on goods imported into the U.S. that may injure or threaten to injure American companies producing the same kinds of products. 

Solar wafers, cells and panels imported from China or Southeast Asian countries that use Chinese wafers and cells to produce panels have been the frequent targets of Section 201 tariffs, dating back to 2012, as outlined in a 2018 fact sheet from the U.S. International Trade Commission (ITC). Cheap, heavily subsidized Chinese panels simultaneously helped build the solar market in the U.S. while undercutting domestic supply chains, which had almost disappeared by 2017, the ITC said. 

A 2017 petition from two U.S. solar companies ― Suniva and Solar World ― resulted in the Trump administration imposing Section 201 tariffs on imported solar cells and panels for four years, with a declining rate beginning at 30% in 2018 and falling 5% per year until reaching 15% in 2022. 

In February of 2022, Biden extended the tariffs for another four years, with a minimal 0.25% step-down per year. Bifacial panels were excluded from the tariffs, first during the Trump administration, and then again by Biden. 

The tariffs were largely ineffective at stimulating solar manufacturing in the U.S., as Chinese companies shifted production first to Taiwan and then to Southeast Asia. A new case, again brought by U.S. solar companies, resulted in a 2022 decision by the U.S. trade representative to impose tariffs on solar imports from Cambodia, Malaysia, Thailand and Vietnam. 

Under heavy lobbying from the solar industry, Biden granted a two-year moratorium on those tariffs. The president framed the hold as a “bridge” intended to allow for the buildout of a U.S. solar supply chain, which has begun spurred not by tariffs but by the IRA’s tax credits.  

According to DOE, since passage of the law, close to $17 billion in private investments have been announced in new or expanded solar manufacturing projects.  

The two-year moratorium runs out June 6, and the May 16 announcements confirmed Biden will not extend it. At the same time, a new Section 201 investigation (Investigation 701-722) against Southeast Asian solar imports is under way, this time filed by a group of solar manufacturers now building out facilities in the U.S., some of them domestic startups and some subsidiaries of foreign-owned companies.  

A hearing on the petition was held May 15, and the ITC is scheduled to submit its findings to the Commerce Department in June. 

Can US Compete?

The administration’s focus on growing a healthy, competitive solar supply chain combines Biden’s drive to stimulate private investment in clean tech manufacturing and jobs, and current bipartisan concerns about Chinese trade practices, including the use of forced labor.  

A domestic supply chain supporting strong solar market growth also may be critical for Biden’s goal of decarbonizing the nation’s electric grid by 2035. According to DOE’s 2021 Solar Futures Study, solar projects could generate 40% of the electric power needed to hit that target, but getting there will require deploying 30 GW of projects per year through 2025 and then 60 GW per year through 2030. 

The same day as Biden’s announcement on the Section 201 tariffs, the Solar Energy Industries Association (SEIA) announced that more than 5 million residential, commercial and utility-scale solar installations were online in the U.S. SEIA predicts deployments will accelerate to 10 million by 2030 and 15 million by 2034. 

According to SEIA and WoodMac’s most recent Solar Market Insight report, the U.S. installed a record 32.4 GW of solar in 2023, up a whopping 51% over 2022, putting it on track to meet the Solar Futures report targets. Deployments this year are expected to be more modest, approaching 38 GW.  

But whether U.S. solar manufacturers can compete with China ― even with a federally supported and well-developed supply chain ― remains an open question, one that is at the heart of the use of tariffs to protect and expand domestic production. 

China seems to have a hard lock on the global solar market. The Chinese Photovoltaic Industry Association has estimated that solar manufacturers in the People’s Republic of China (PRC) could produce up to 750 GW of modules, or panels, in 2024, along with 820 GW of solar cells and 935 GW of silicon wafers, the core component in solar cells, according to TaiyangNews, an online publication covering the Chinese solar industry. 

By comparison, WoodMac has estimated that by 2027, a built-out U.S. supply chain could produce about 3.3 GW of silicon wafers, 18 GW of solar cells and 66 GW of solar panels. In other words, the domestic industry could produce enough panels to meet the deployment levels in the Solar Futures report but still would need to import wafers and cells. 

“There’s very little financial incentive to manufacture machinery and upstream solar components in the U.S.” Pierce said in an email to NetZero Insider. “A module does not need to be made with a domestic wafer to qualify for the domestic content bonus adder, and imported wafers are not tariffed nearly as much as cells and modules.  

“Chinese wafers are subject to the 25% Section 301 tariff, but they’re currently so cheap that the tariff is relatively insignificant. As such, we expect wafer manufacturing capacity to be much lower than domestic cell and module manufacturing capacity.” 

Reflecting such market realities, solar industry trade and advocacy groups have been strategically selective in their statements of support for the May 16 announcements. SEIA has a long history of opposing tariffs on imported solar panels, and CEO Abigail Ross Hopper praised the potential increase in the tariff-rate quota of cells allowed in duty free but was silent on the reimposition of the Section 201 tariffs and the pending ITC investigation.  

A statement from Ray Long, CEO of the American Council on Renewable Energy, also made no mention of the tariffs, focusing instead on the Treasury Department’s guidance on the domestic content bonus credit and its safe harbor provisions.  

“Having clear rules of the road is critical for companies seeking to invest in America’s clean energy future, and [the] additional guidance on domestic content provides helpful clarity,” Long said. “Once successfully implemented, this bonus credit will help catalyze billions in private sector investment and thousands of good-paying jobs by boosting clean energy deployment and increasing the competitiveness of American-made products. “ 

What Developers are Saying

How the tariffs affect solar projects in the development pipeline likely will vary among installers. Generally, with the 90-day off-ramp for developers with existing contracts for bifacial panels and the six-month limit on stockpiling, little impact is expected for the rest of 2024. 

Looking beyond the near term, Reagan Farr, CEO of Silicon Ranch, a commercial installer based in Tennessee, said he doesn’t expect the tariffs to affect his company’s bottom line because it already has a strong U.S.-based supply chain and long-term agreements with manufacturers to ensure it doesn’t need to stockpile.  

“We [pay] a bit of a premium for domestic content,” Farr said. “I felt like minimizing logistics risk and having the economic development narrative tied to that equipment was worth the premium.” 

Still, Farr calls the return of the Section 201 tariffs “a no-brainer move by the White House” to protect the private investment in solar manufacturing triggered by the IRA’s tax credits.  

“We’re asking companies to make $100 million, up to $1 billion-type investments [to] onshore manufacturing capacity in the U.S.,” Farr said. “And if we don’t have smart policies like that, you’re never going to get companies to trust you again. So I think this was almost a necessity.” 

Jeff Weiss, executive chairman of Distributed Sun, a Washington, D.C.-based developer, argues the administration needs to do more to draw foreign companies to build or expand their factories in the U.S. Building out domestic supply chains will take time, and incentives beyond the IRA may be needed, he said.  

Looking at the domestic content bonus credits, Weiss said, “They should have the widest aperture in defining the 40% [requirement] in order to encourage more people, more companies to invest in American manufacturing. The narrower that definition, the more difficult it is to comply.” 

Ava Duane, a sales operation analyst at New Columbia Solar, a commercial solar developer in Washington, D.C., said her company started diversifying its supply chains about six to eight months ago, largely in response to the IRA’s bonus tax credits for domestic content. 

“The tariffs that were announced [May 16] are not super shocking,” Duane said. “I think a lot of folks have seen this coming and … have been moving to diversify their supply chains to take advantage of the other things that the White House has done to make domestic content more feasible from a price standpoint.  

“We actually get a lot of customers who ask about domestic content and [we have] … been able to enter into agreements with suppliers where we can reach a certain threshold of American-made components on our systems and so on. It’s actually been kind of customer-driven as well. 

”Prices for solar panels likely will rise, which “will affect the amount of capacity that we’re able to deploy … and that being said, this also just affects all sorts of customers,” Duane said. “How many folks are going to think about putting solar on their home because the modules will be more expensive, at least in the medium-term future? I do expect there to be a bit of market turbulence, and there probably will be a slowdown.” 

Duane said she expects the IRA tax credits will at least blunt some of the impacts of price increases, but that “it’s really just a question of how quickly the supply chains can ramp.” 

PJM MRC/MC Preview: May 22, 2024

Below is a summary of the agenda items scheduled to be brought to a vote at the PJM Markets and Reliability Committee and Members Committee meetings this Wednesday. Each item is listed by agenda number, description and projected time of discussion, followed by a summary of the issue and links to prior coverage in RTO Insider.

RTO Insider will cover the discussions and votes. See next week’s newsletter for a full report.

Markets and Reliability Committee

Consent Agenda (9:05-9:10)

The committee will be asked to endorse as part of its consent agenda:

C. proposed revisions to Manual 3: Transmission Operations drafted through the document’s periodic review. (See “First Read on Periodic Review Manual Revisions,” PJM OC Briefs: April 4, 2024.)

D. proposed revisions to Manual 36: System Restoration, including administrative changes identified through periodic review.

Endorsements (9:10-9:50)

1. Capacity Obligations for Forecasted Large Load Adjustments (9:10-9:35)

PJM’s Pete Langbein will present a proposal to revise how capacity obligations stemming from forecast large load additions are assigned. Lynn Horning, of American Municipal Power, will present an alternative proposal. (See “Changes to Capacity Assignments for Large Load Additions Contemplated,” PJM MRC Briefs: April 25, 2024.)

The committee will be asked to endorse revisions to the tariff, Reliability Assurance Agreement and Operating Agreement.

Issue Tracking: Capacity Obligations for Forecasted Large Load Adjustments

2. Demand Response Availability Window (9:35-9:50)

Bruce Campbell, principal of Campbell Energy Advisors, representing demand response providers, will present a quick-fix proposal to extend the winter availability of DR resources. (See “Demand Response Providers Seek Expanded Availability,” PJM MRC/MC Briefs: Feb. 22, 2024.)

The committee will be asked to approve the proposed issue charge and endorse the proposed solution to key work activity 2 using the quick-fix process, which allows an issue charge and proposed solution to be voted on concurrently.

Members Committee

Consent Agenda (11:35-11:40)

The committee will be asked to endorse as part of its consent agenda:

B. proposed governing document revisions focused on correcting grammatical, formatting and reference errors in language around the interconnection process. The changes were drafted by the Governing Documents Enhancements and Clarifications Subcommittee.

C. proposed revisions to the OA, tariff and Manual 15: Cost Development Guidelines to add three market parameters for synchronous condensers: condense start-up costs, condense-to-generate costs and condense energy use. (See “Other MRC Business,” PJM MRC Briefs: April 25, 2024.)

Developers Urge New Target for Pacific Offshore Wind

SACRAMENTO, Calif. — Developers of floating offshore wind are calling on the California Public Utilities Commission to increase procurement targets to 10 GW by 2035, up from the initial goal of 2 GW to 5 GW by 2030, accounting for the total combined capacity that can be delivered by the state’s five new leaseholders. 

“We and the other leaseholders think that the state should be targeting 10 GW by 2035 as a nice, clear, strong signal of where we’re heading that keeps us on track to meet our climate targets and our offshore wind goals,” Rick Umoff, director of government affairs at Vineyard Offshore, said at the Pacific Offshore Wind Summit, held May 13 to 15 at the SAFE Credit Union Convention Center. 

Vineyard Offshore is one of the five companies that obtained leases in June 2023 to develop floating offshore wind off the California coast, and it plans to deploy up to 2 GW of power off Humboldt County. The other leases are held by RWE Offshore Holdings, Invenergy, Equinor and Golden State Wind. 

Along with 2 GW to 5 GW by 2030, the California Energy Commission set a goal of deploying 25 GW by 2045. But leaseholders are asking the CPUC to set an interim target of 10 GW by 2035 to stimulate supply chain development and economies of scale needed for investment. The commission is conducting a needs assessment and will have an initial determination by Sept. 1, said an ACP California spokesperson. 

“We think it’s incredibly important that the needs assessment recognizes the need for 10 GW of offshore wind development and procurement,” Martin Goff, head of renewables at Equinor, said in a summit panel. “We need to be bold at that type of scale to really get the investment needed in this industry.” 

Equinor is responsible for the Atlas Wind project, which will deploy 2 GW of power 60 miles off the coast of Morro Bay. Goff said volume, predictability and certainty are essential to reaching the 10-GW target, and central procurement is one way to get there. The new target would also help signal investment in the transmission needed to accommodate the facilities. 

“It’s critical that we have those volumes, the 10 GW, in this needs assessment so that you can trigger that investment in the transmission,” Goff said. “If it’s done on a strategic level, then it takes that transmission away from the generation costs, puts it into a fixed charge … and gets spread out across the state in terms of cost and not put on the developers and the ultimate cost of energy.” 

Last year, the state passed AB 1373, enabling the Department of Water Resources to conduct central procurement of eligible long-lead-time resources, including offshore wind, until January 2035. (See California Governor Seeks Central Procurement Authority.) The bill gives developers a positive market signal and the confidence to invest in the substantial and expensive infrastructure needed to build floating offshore wind, Goff said. 

“The central procurement entity, it’s a tool in the toolbox,” said Leuwam Tesfai, deputy executive director for energy and climate policy at the CPUC. 

Central procurement will ensure that more expensive energy like offshore wind is purchased, said V. John White, executive director at the Center for Energy Efficiency and Renewable Technology. 

“I think the challenge is [load-serving entities] aren’t buying these resources on their own because they’re more expensive and because they’re used to buying the cheapest resource possible,” White said. “What the central procurement offers is the opportunity for the PUC to take that decision on behalf of all the LSEs and procure resources competitively knowing that the LSEs are willing to be the ones to take it.” 

Cost Concerns

Developers and utilities expressed concern over the costs associated with the buildout of offshore wind and how central procurement could play a role. 

“Knowing that these resources are more expensive, how do we know that we’re getting the best price? I think there may need to be some considerations, or what I might call open book bidding, where we would disclose all the costs, the profits … so that you know there’s no hidden markup,” White said. 

Cost overruns and ratepayer protection were key among utility concerns when considering central procurement. Adam Smith, director of regulatory relations at Southern California Edison, questioned whether ratepayers would “eat” the substantial costs associated with offshore wind development. 

“What we would like to see is that our ratepayers are guaranteed the same guardrails and protections that they would see if the LSEs were doing the procuring,” Smith said. “If the state decides to go there, we just want to make sure our customers are protected.” 

Texas PUC Prepping Reliability Standard for Comment

The Texas Public Utility Commission’s staff, having been waved forward by commissioners, are preparing for public comment a revised version of ERCOT’s proposed reliability standard. 

During its May 16 open meeting, the commission agreed with staff suggestions that two of ERCOT’s three metrics be tweaked to strengthen their effectiveness.  

“Coming up with reliability standard is really mission critical to what we’re doing on the wholesale market design side,” PUC Chair Thomas Gleeson said. 

The Texas grid operator has proposed a “multi-metric” framework that establishes thresholds for three metrics: frequency, duration and magnitude of loss-of-load events (54584). PUC staff filed comments May 9 recommending changes to the duration and magnitude values’ calculations. (See related story, ERCOT Proposes ‘Multi-metric’ Approach for Reliability Standard.) 

Commissioner Lori Cobos suggested ERCOT include the normalized expected unserved energy (EUE) to provide an idea of the load that won’t be served. ERCOT has said EUE is an average measure, like the loss-of-load expectation, and does not distinguish the characteristics of extreme events. The grid operator did allow that EUE is a useful measure for the expected cost of not meeting customer firm-load requirements and the expected incremental cost of modifying the reliability standard’s elements. 

“I think it’s a helpful perspective to have in addition to the fundamental reliability standard that will be based on the one-in-10 with the additional criteria of duration, frequency and magnitude,” Cobos said. 

Commission staff proposed adding a 0.25% exceedance probability for the 19-GW magnitude metric because it is tied directly to the grid’s operational capability. Cobos said she wants stakeholders, with their comments, to further explore the exceedance number. 

“Based on just my initial thoughts, it seems to be very conservative,” she said, saying the 0.25% exceedance translates to one loss-of-load event every 400 years. Cobos suggested the rule could start at 0.25% but wondered aloud whether stakeholders might want to double it to 0.5%, the equivalent of one loss-of-load event every 200 years. 

“It’s typically easier to start with more stringent standards, say one in 400, and then pull back to something less stringent,” Gleeson said. 

Following stakeholder feedback, a final reliability standard could be published as soon as June 13.

Texas RE: Resources’ Weatherization a Success

The Texas Reliability Entity says its latest regional assessment indicates weatherization activities since the disastrous February 2021 winter storm have paid off. 

David Penney, Texas RE’s director of reliability services, told his Board of Directors on May 15 that state legislation passed since Winter Storm Uri and on-site inspections have both improved resource performance and cold-weather resilience, as measured by outage rates and balancing contingency rates. 

“We definitely see a lot of improvement with resource weatherization,” Penney said, citing the lack of outages during two more recent winter storms. 

The assessment — not likely to be released until June, the entity said — also found: 

    • The solar down-ramp magnitude continues to increase, creating potential energy adequacy shortfalls. 
    • Misoperation rates are improving, but human performance continues to be a primary factor in both misoperations and system events. 
    • Conventional generation fleet outage rates have improved, but long-term outage rates continue to trend higher. 

Penney said the latter problem is found mostly in coal- and lignite-fired resources. 

“A lot of it has to do with the way those units are operated in light [of] how the grid is being operated because of the changing resource mix,” he said. “Those units are being cycled a whole lot more.” 

Texas RE’s annual Assessment of Reliability Performance and Regional Risk Assessment is intended to inform market participants, stakeholders and policymakers of the data it gathers and the risks it sees in the interconnection. The report looks at four main areas: grid transformation, resilience to extreme events, cybersecurity, and cyber and physical security and critical infrastructure. 

The report was once called the “Assessment of Reliability Performance, much to the chagrin of Texas RE CEO Jim Albright. 

“‘Assessment of Reliability Performance’ was easy. ‘ARP.’ We had a nice acronym,” he said in jest, noting the report’s new acronym is ARPRRA. “Now, they’ve added ‘Regional Risk Assessment.’ That acronym gets really long, and it sounds like we’re pirates.” 

Budget, Business Plan OK’d

The board approved its 2025 budget and business plan and an audit of its 2023 financial statements that reported no findings.

Texas RE proposed a 5.9% increase to the budget, from $19.11 million to $20.24 million. It said the key drivers were an 8.1% increase in payroll expense, a projected 10% increase over current actual rates for medical insurance premiums and additional compliance oversight obligations requiring more staff travel. 

The budget was approved by the Members Representative Committee in April and posted for members’ comments May 7. It will now be sent to NERC.