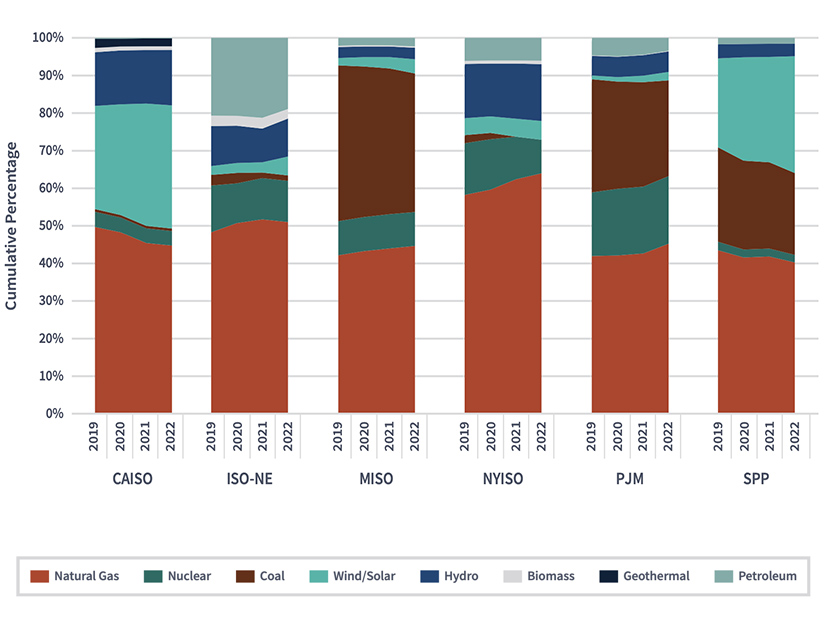
FERC on Jan. 30 released the latest iteration of its Common Metrics Report on ISO/RTO markets, which evaluates the performance and benefits of organized markets.
The commission has released these reports every few years since Congress’ Government Accountability Office suggested it do more to track the performance and benefits of ISO/RTOs back in 2008. The report shows the different fuel mixes from FERC’s six jurisdictional organized markets and how much they each rely on demand response.
Some past reports have included similar data from utilities outside of ISO/RTO footprints, but none of them responded to FERC’s efforts this time.
The highest share of DR is in CAISO at 10%, while MISO, NYISO and PJM each have 3-6%. ISO-NE and SPP both reported less than 2%. DR in SPP grew significantly in 2022, hitting about 2% after minimal levels in earlier years.
ISO-NE and MISO added generation in each year from 2019 to 2022, while both PJM and NYISO lost capacity overall during that time.
FERC staff collected information on 29 common metrics across the six ISO/RTOs split across three broader categories: administrative and descriptive metrics; energy market metrics; and capacity market metrics.
CAISO, ISO-NE, MISO and NYISO all had actual reserve margins below their expected levels between 2019 and 2022, with MISO seeing the biggest gap. Only PJM had higher actual reserve margins than expected in all four years, while SPP flipped between both categories every year.
Every organized market reported that natural gas was their single largest fuel type from 2019 to 2022 with NYISO seeing the biggest increase in the fuel — from 58% to 64% — while ISO-NE, MISO and PJM each reported a modest increase. CAISO saw natural gas share fall from 49% to 41% over the period, while SPP saw a more modest drop from 43% to 40%.
“The decline in the share of natural gas-fired capacity in these regions is likely driven by the relatively large increases in wind and solar generating capacity, instead of natural gas retirements,” the report said.
MISO, PJM and SPP all had a significant amount of coal in the fuel mixes, and all saw it drop. Coal in PJM fell from 30% in 2019 to 25% in 2022, MISO saw it fall from 41% to 37% and SPP from 25% to 22%. The other markets all reported less than 3% coal in their markets.
SPP and CAISO had the highest shares of installed wind and solar generating capacity, with the two renewables representing 31% of capacity in SPP and 30% in the California ISO.
“The largest relative increase in generating capacity of these resource types occurred in SPP, where the share of wind and solar capacity increased from 24% in 2019 to 31% in 2022,” FERC said.
The report also included how often each market had to issue Energy Emergency Alerts across the four years studied, with CAISO seeing 16, MISO 10, PJM six, SPP five and ISO-NE one.

